Design Systems • Product Design • UX Design
OneViu – Tecsa
Services
- Product Design
- Enterprise UX/UI Design
- Retail Analytics Platform Design
- Data Visualization & Complex Reporting UX
- User Research & Validation Sessions
- Wireframes & User Flows
- Design System (MUI)
- Interactive Prototyping in Figma
- Cross-functional Collaboration with PM, DS & Engineering
Client
Description
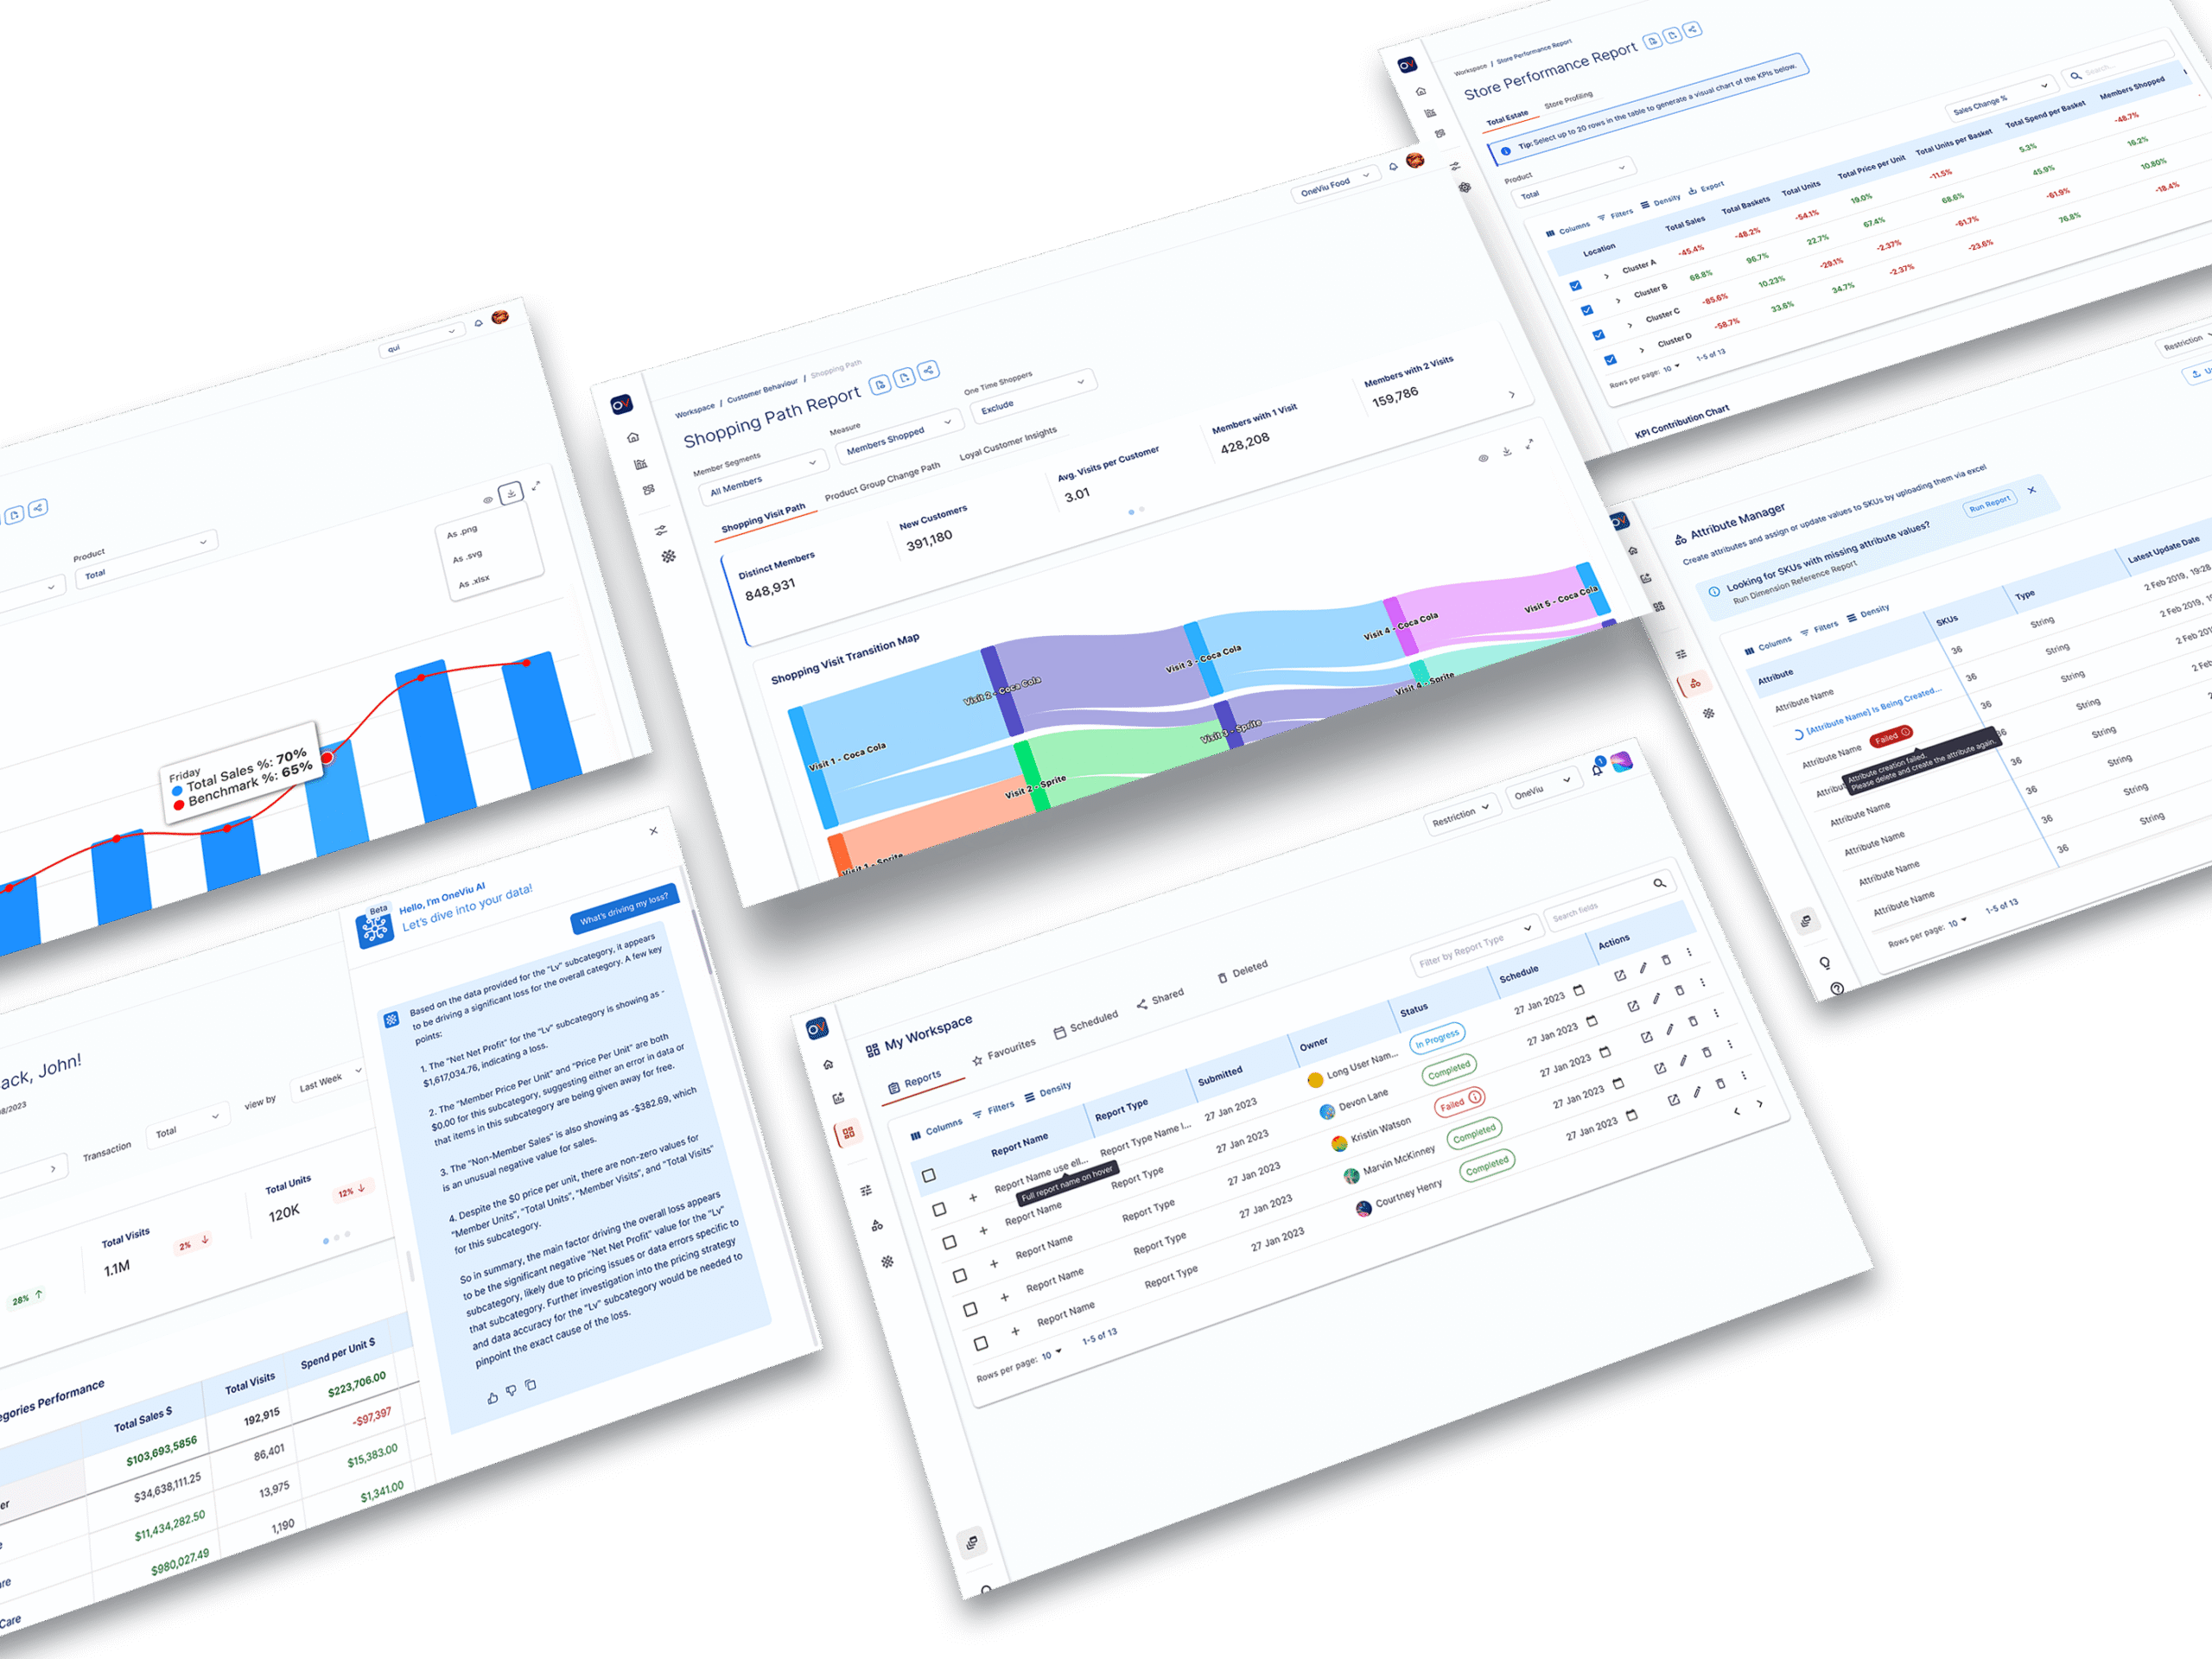
Led design of Tecsa’s Retail Analytics Platform, transforming complex retail data into intuitive, actionable insights for global consumer-facing businesses. Played a leading role in the OneViu platform, supporting the successful POC that secured a major client, Charoen Pokphand Group (CP Group). Reimagined customer journey visualisations, report organisation, and audience segmentation tools, enabling deeper analysis of shopping behaviour, cross-category assortment, and store-level performance.
Purpose
Tecsa’s OneViu Retail Analytics Platform was designed to transform complex, multi-channel retail data into actionable insights for enterprise clients. Key clients included Charoen Pokphand (CP) Group, a leading integrated retail and wholesale business operating thousands of 7-Eleven, Makro, and Lotus stores across Thailand and China, and DFI Retail Group, a major Asian retailer with over 7,500 outlets delivering quality, value, and service across multiple divisions. The platform enables category managers and analysts to analyse shopping behaviour, cross-category assortment, and store-level performance, supporting faster, data-driven decision-making.
Selected Projects
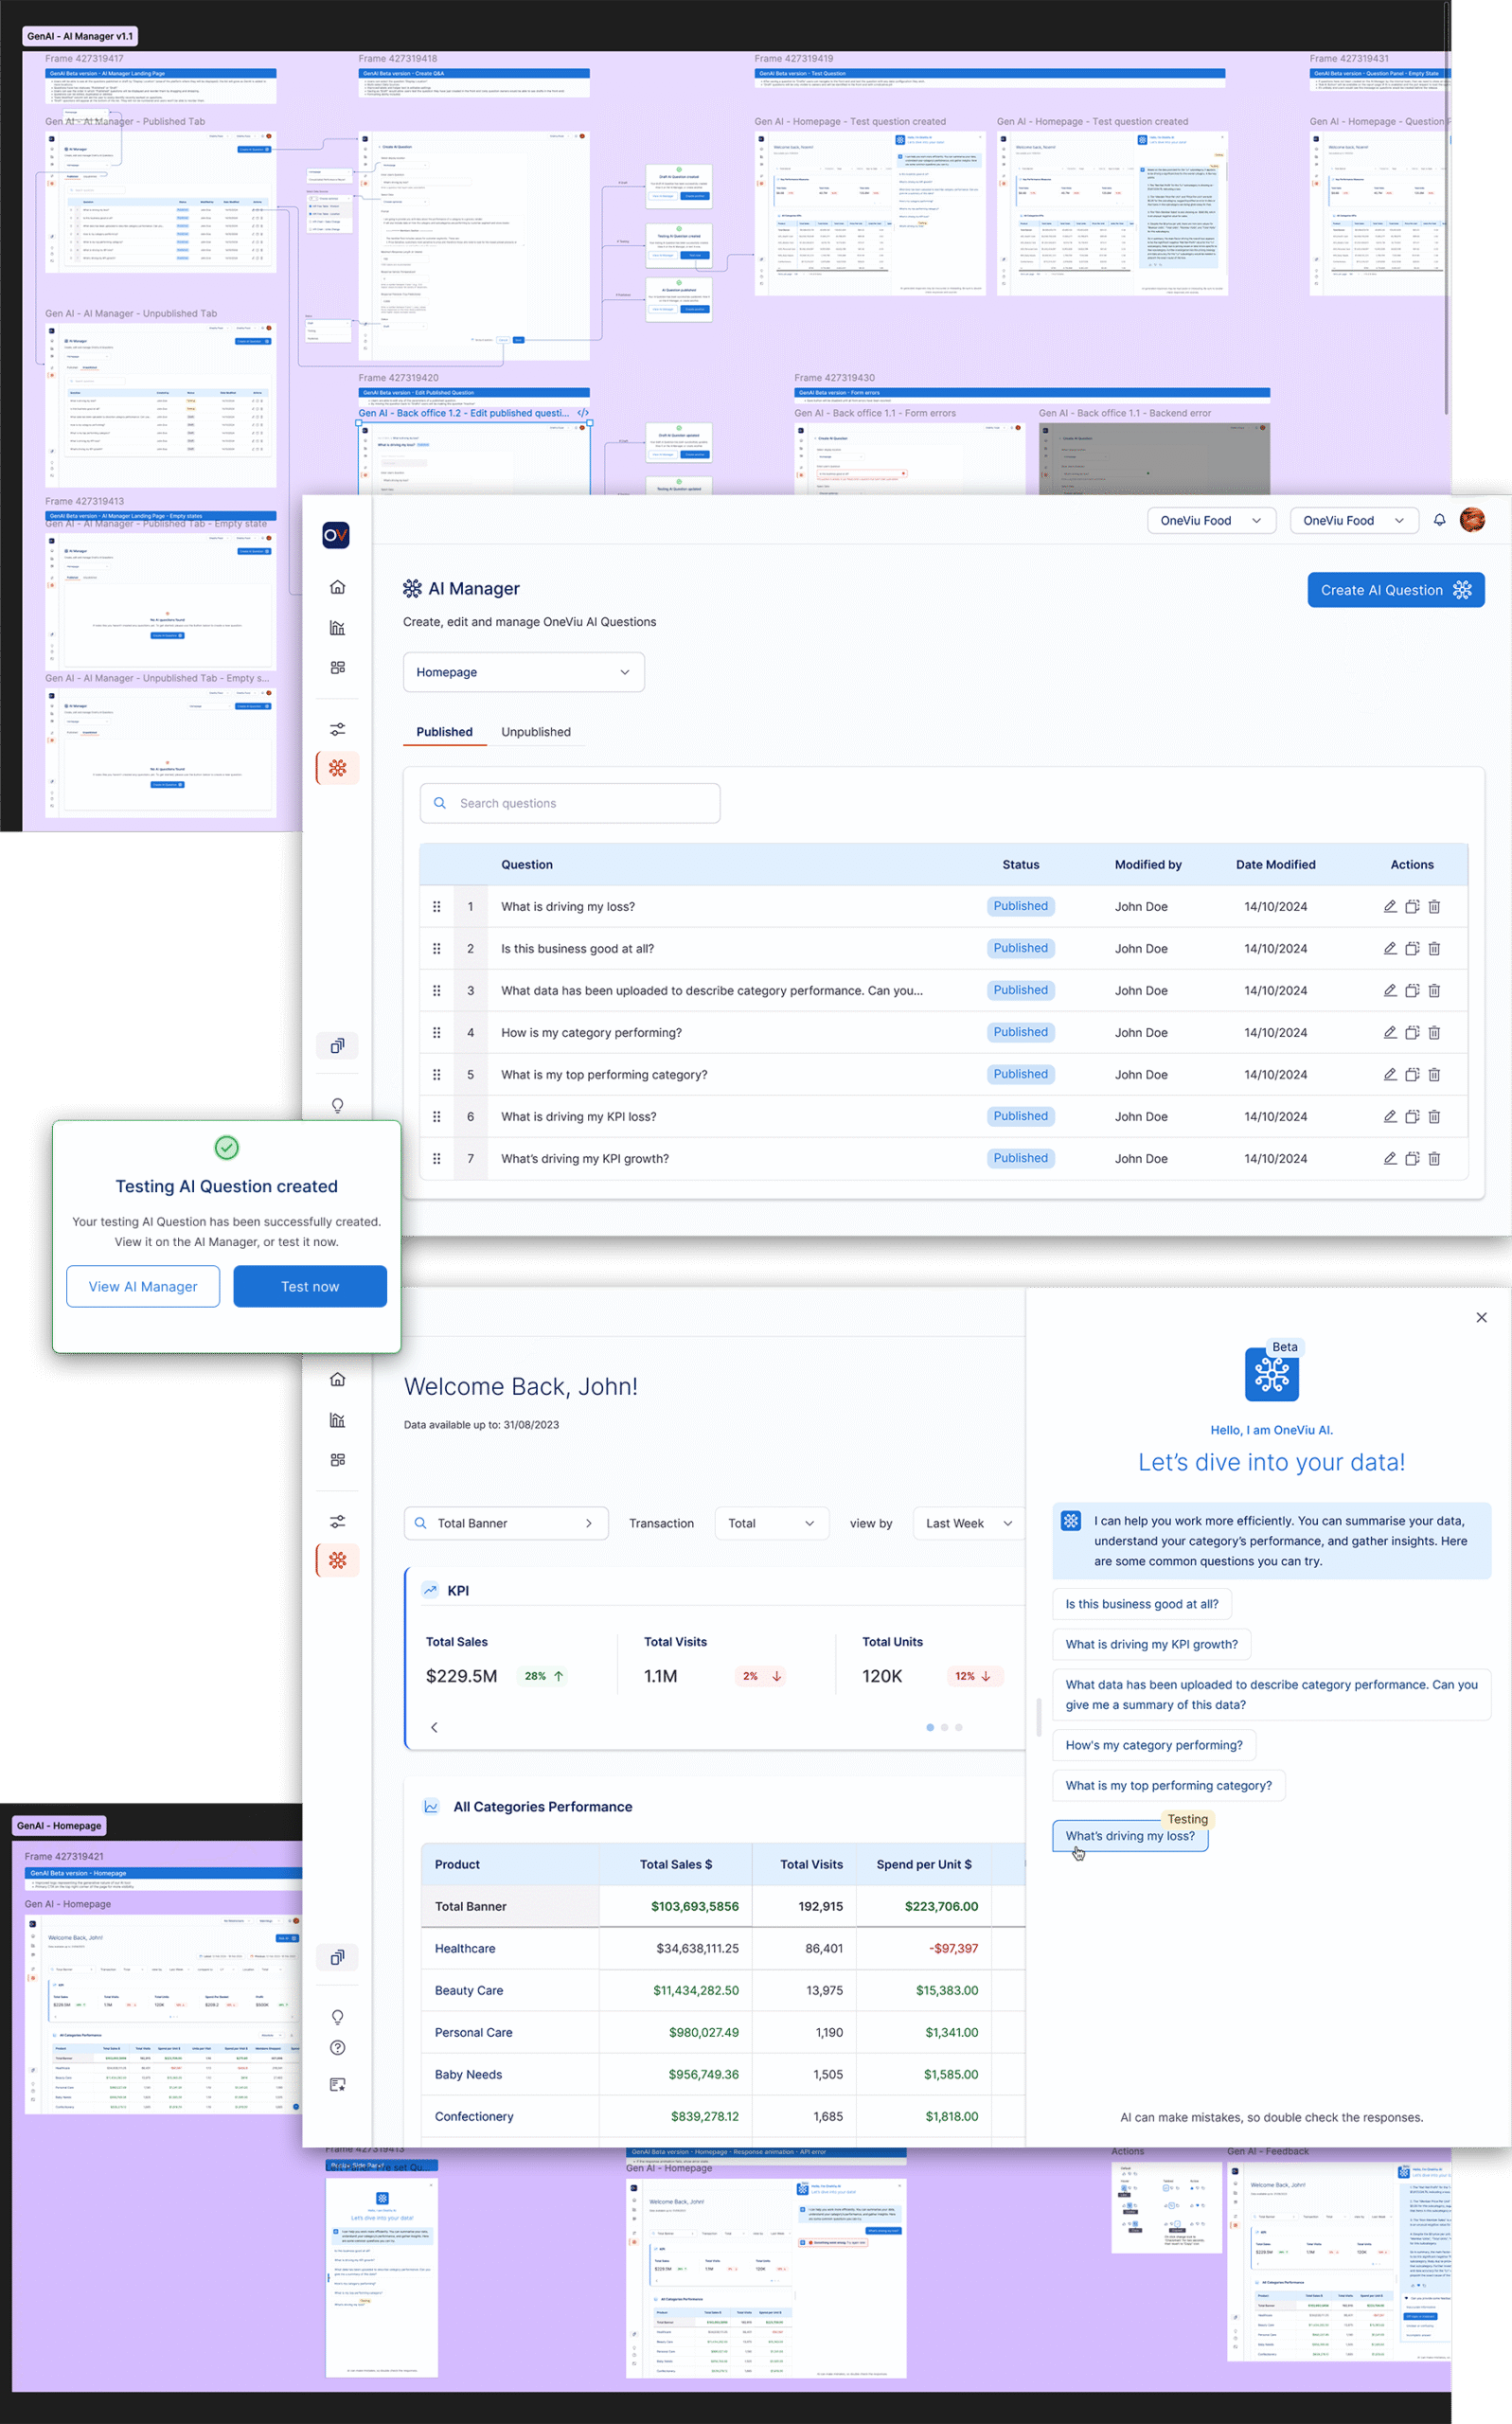
- OneViu Gen AI – Retail Analytics Platform: Designed the Beta and POC phases of a Generative AI feature to surface actionable insights from retail data. Delivered secure, private AI outputs for Super Users and business analysts, redesigned AI Config areas, and integrated AI insights into Home Page dashboards and reports. Supported CP Group POC and platform-wide adoption.
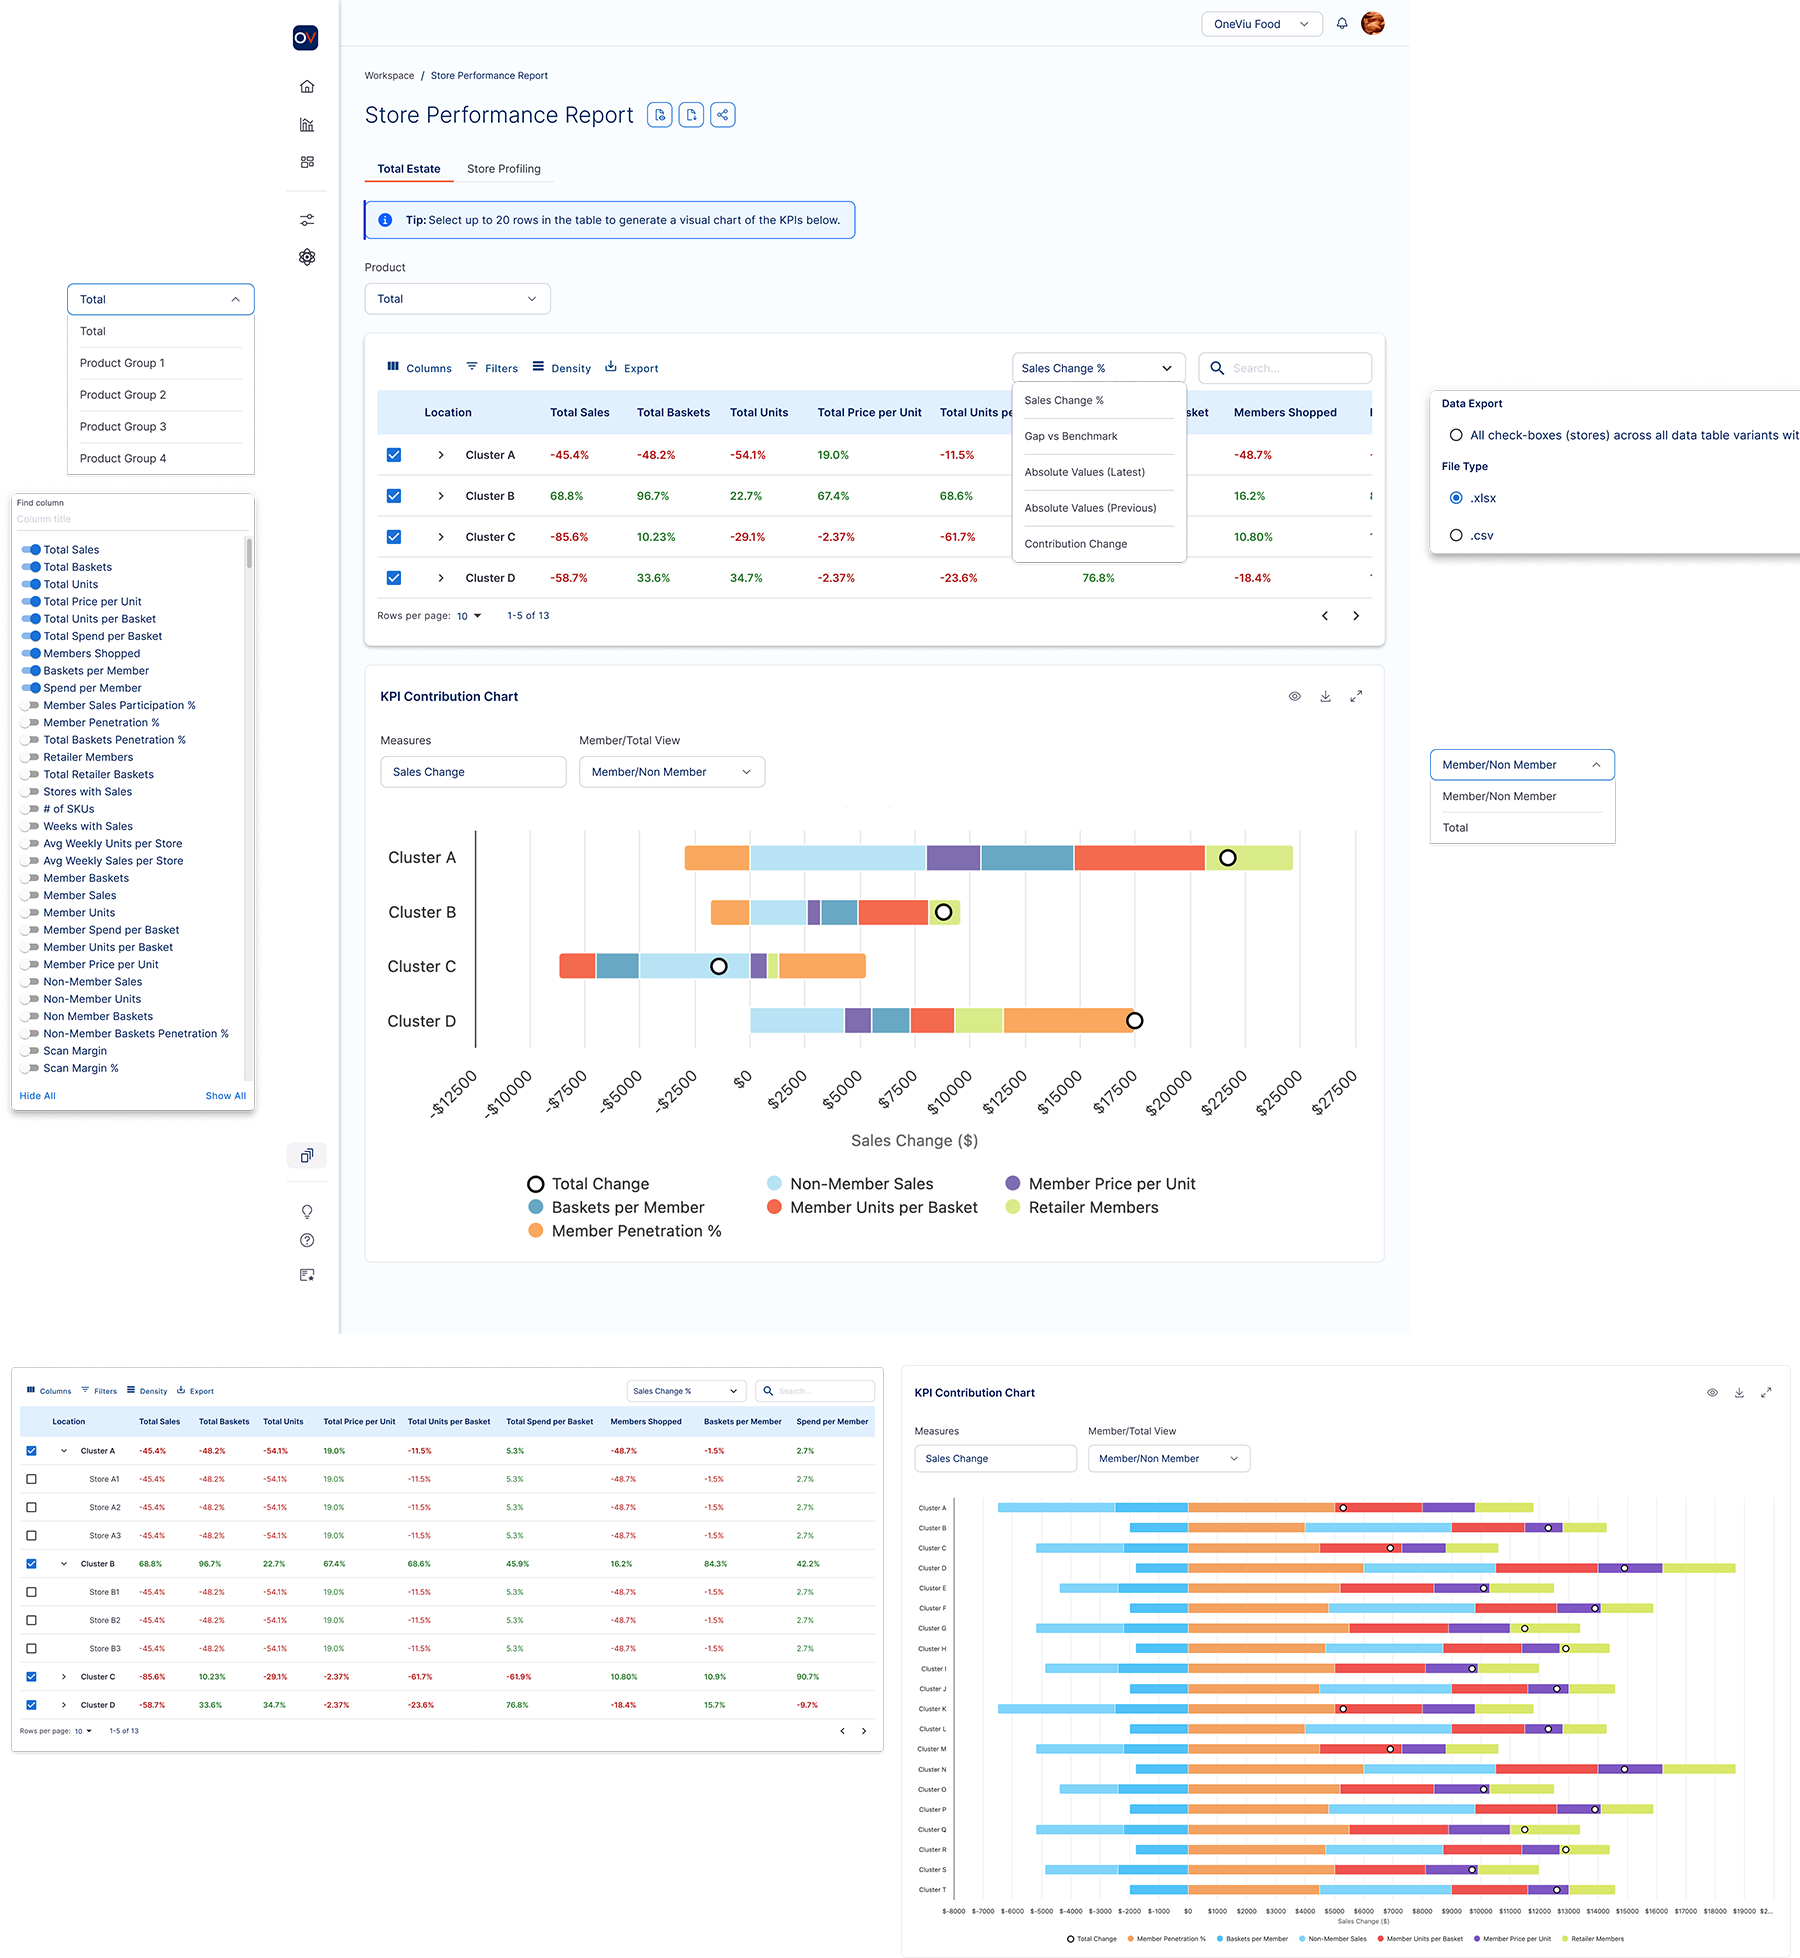
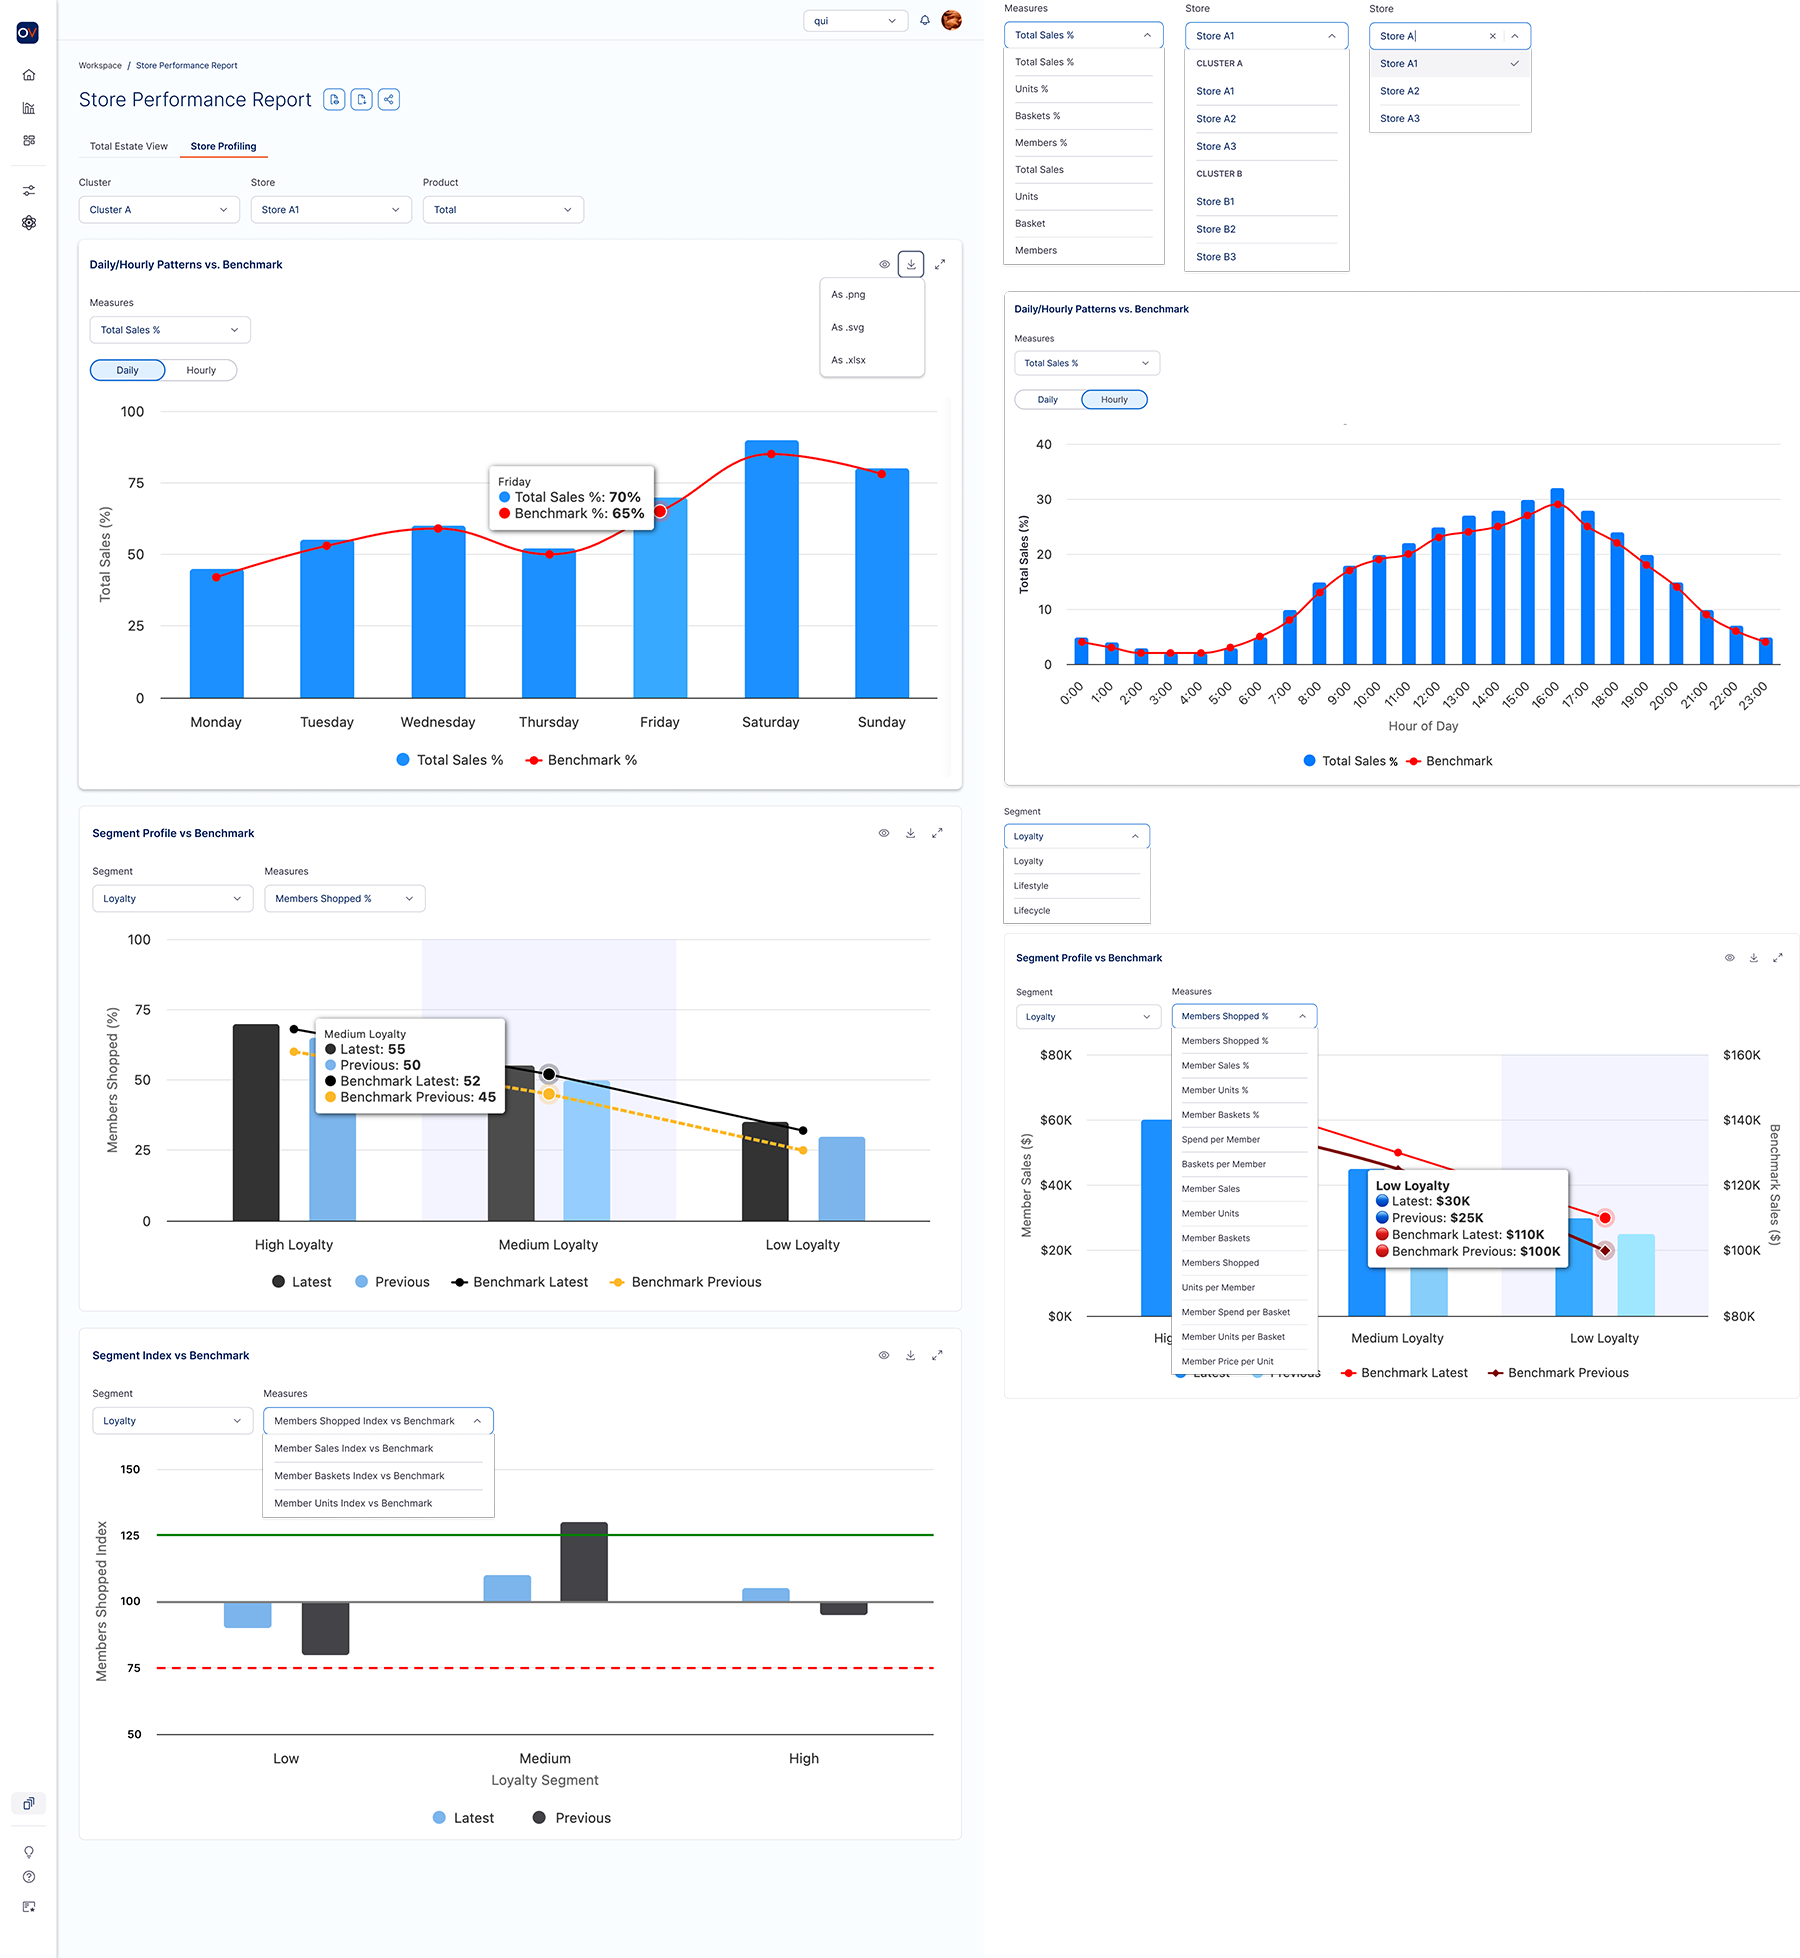
- Store Performance Report: Designed the Store Performance Report to help enterprise users benchmark thousands of stores, identify underperformance, and diagnose root causes at scale. Solved massive grid and chart challenges, guided users with warnings and constraints, and enabled deep KPI exploration across three tabs: Total Estate, Store Profiling, and Store Performance.
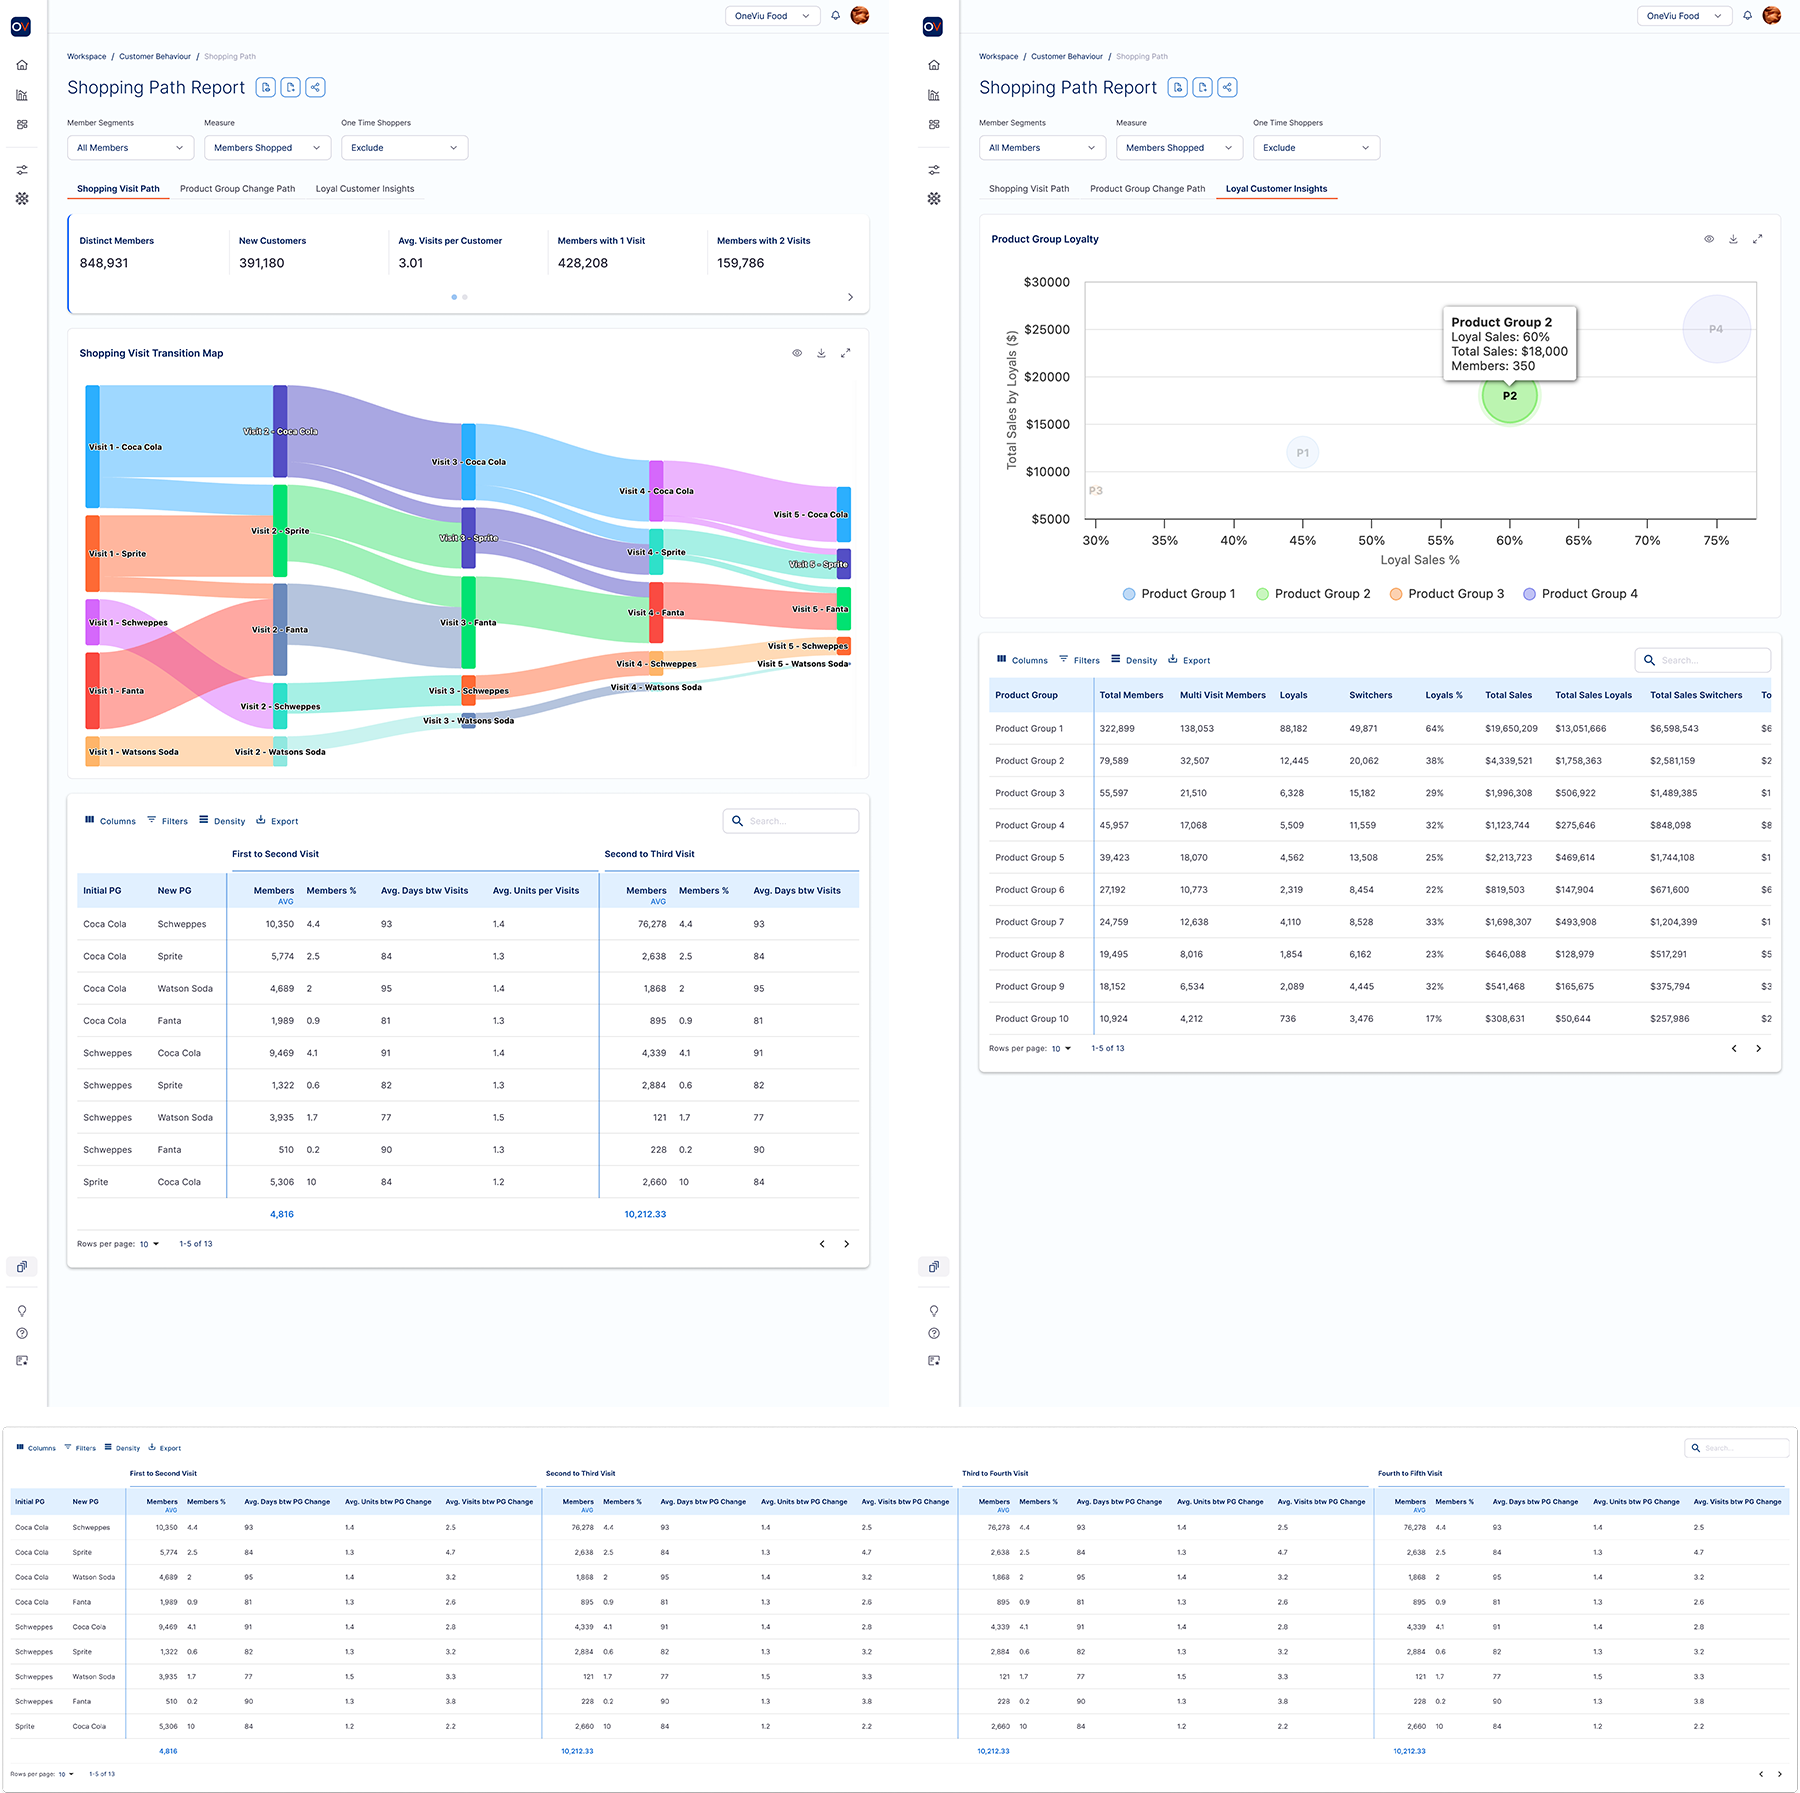
- Shopping Paths Report: Developed interactive Sankey charts and detailed data tables to visualise customer shopping behaviour across product groups and visits. Supported insights into cross-shopping, basket size changes, and channel migration.
- Report Builder Time Dimension Improvements: Enhanced date and time selection workflows, including shortcuts for rolling and trended weeks, clearer comparison periods, and improved Financial & Promo Week selection. Reduced cognitive load and improved consistency across reports.
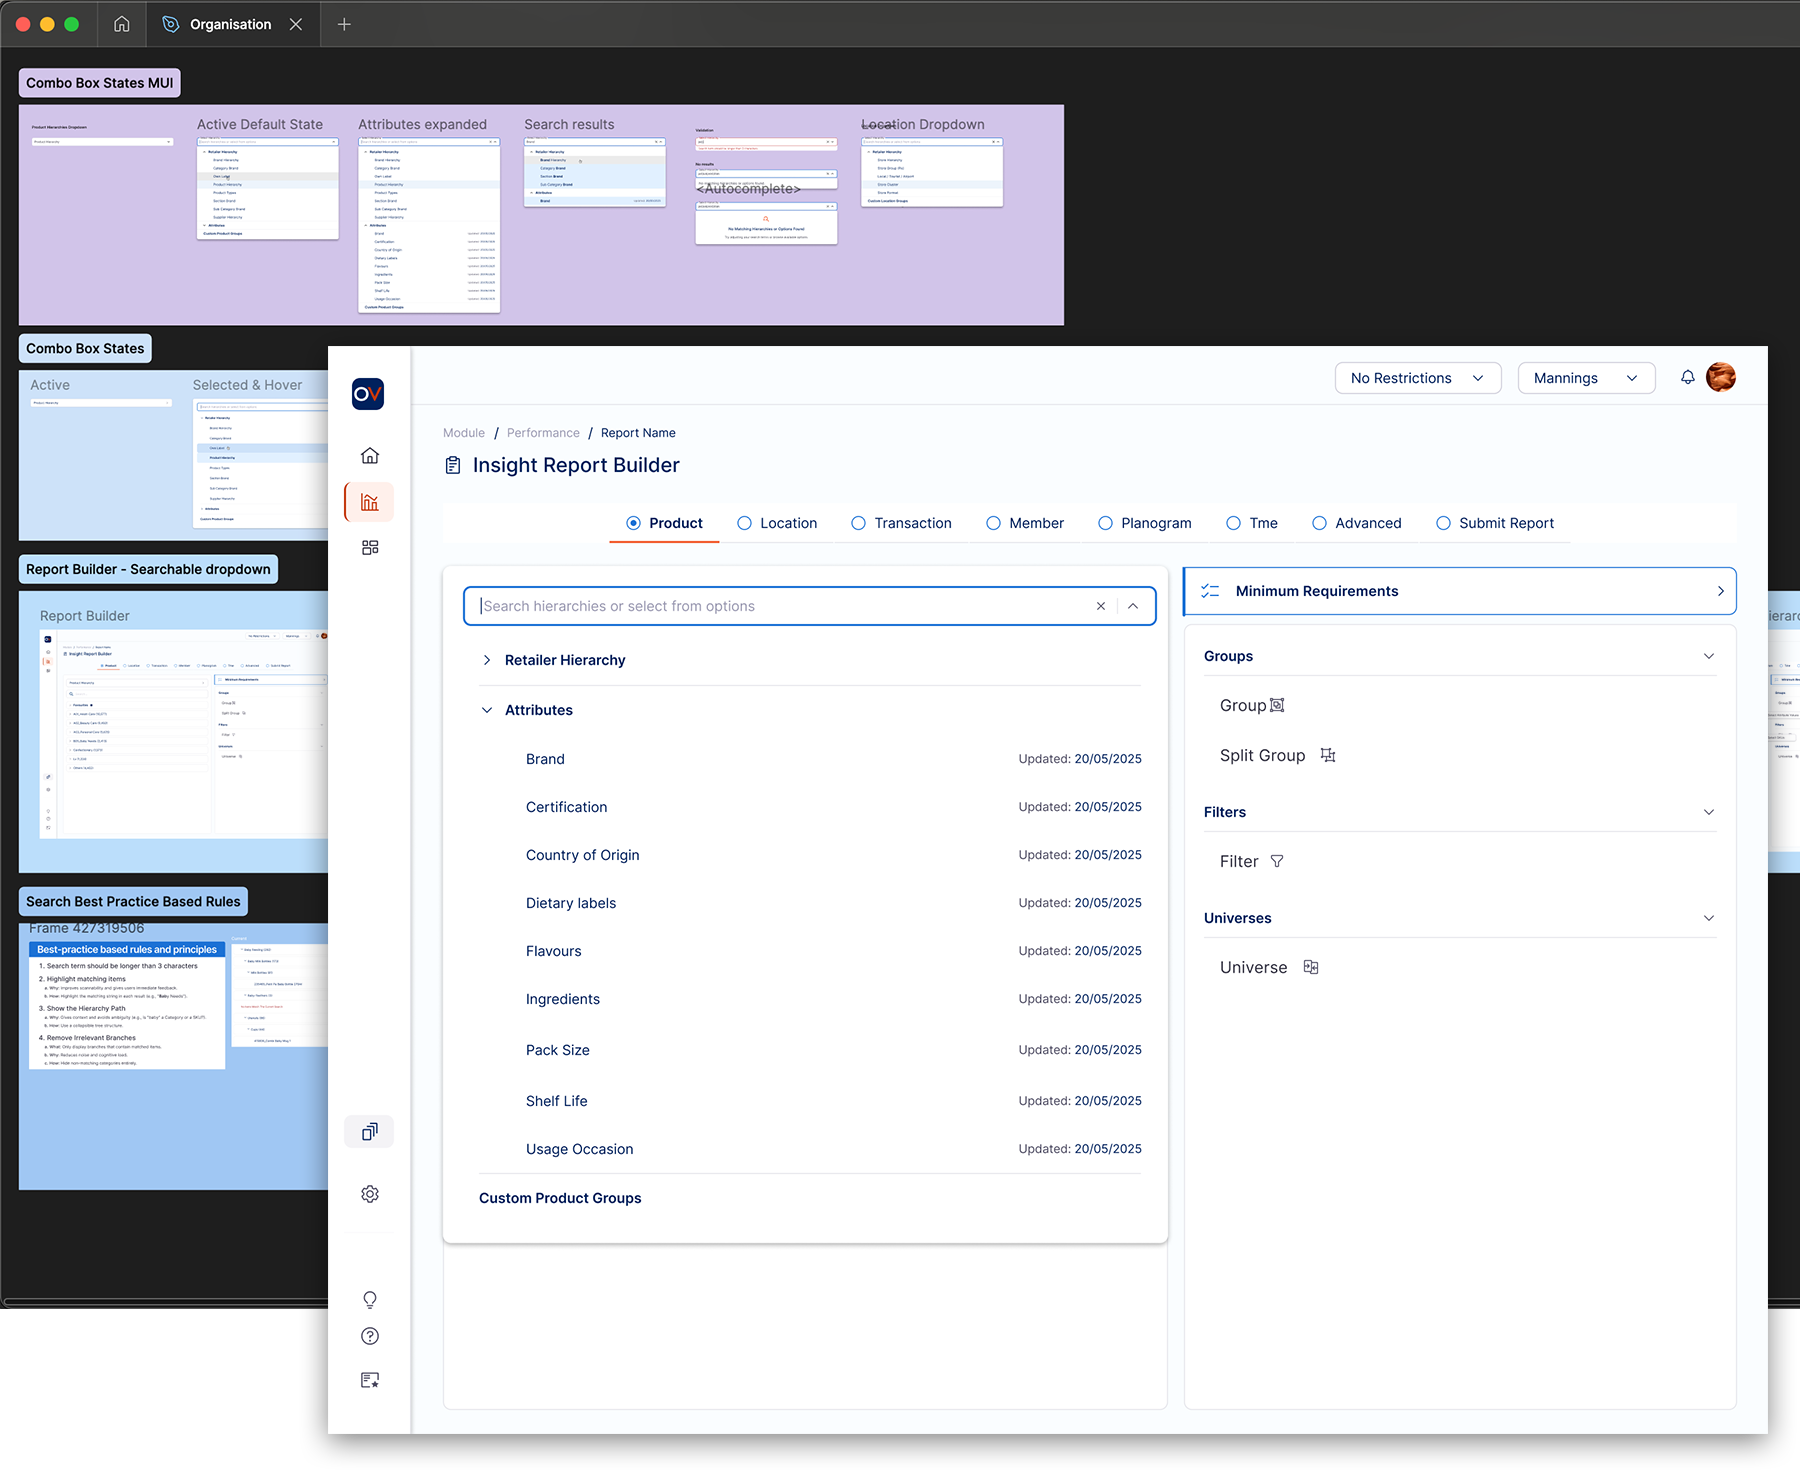
- Organising and Finding Attributes: Redesigned the organisation of attributes within the platform to improve findability and multi-selection workflows. Introduced nested label structures, improved search/filtering, and streamlined attribute management for faster report building.
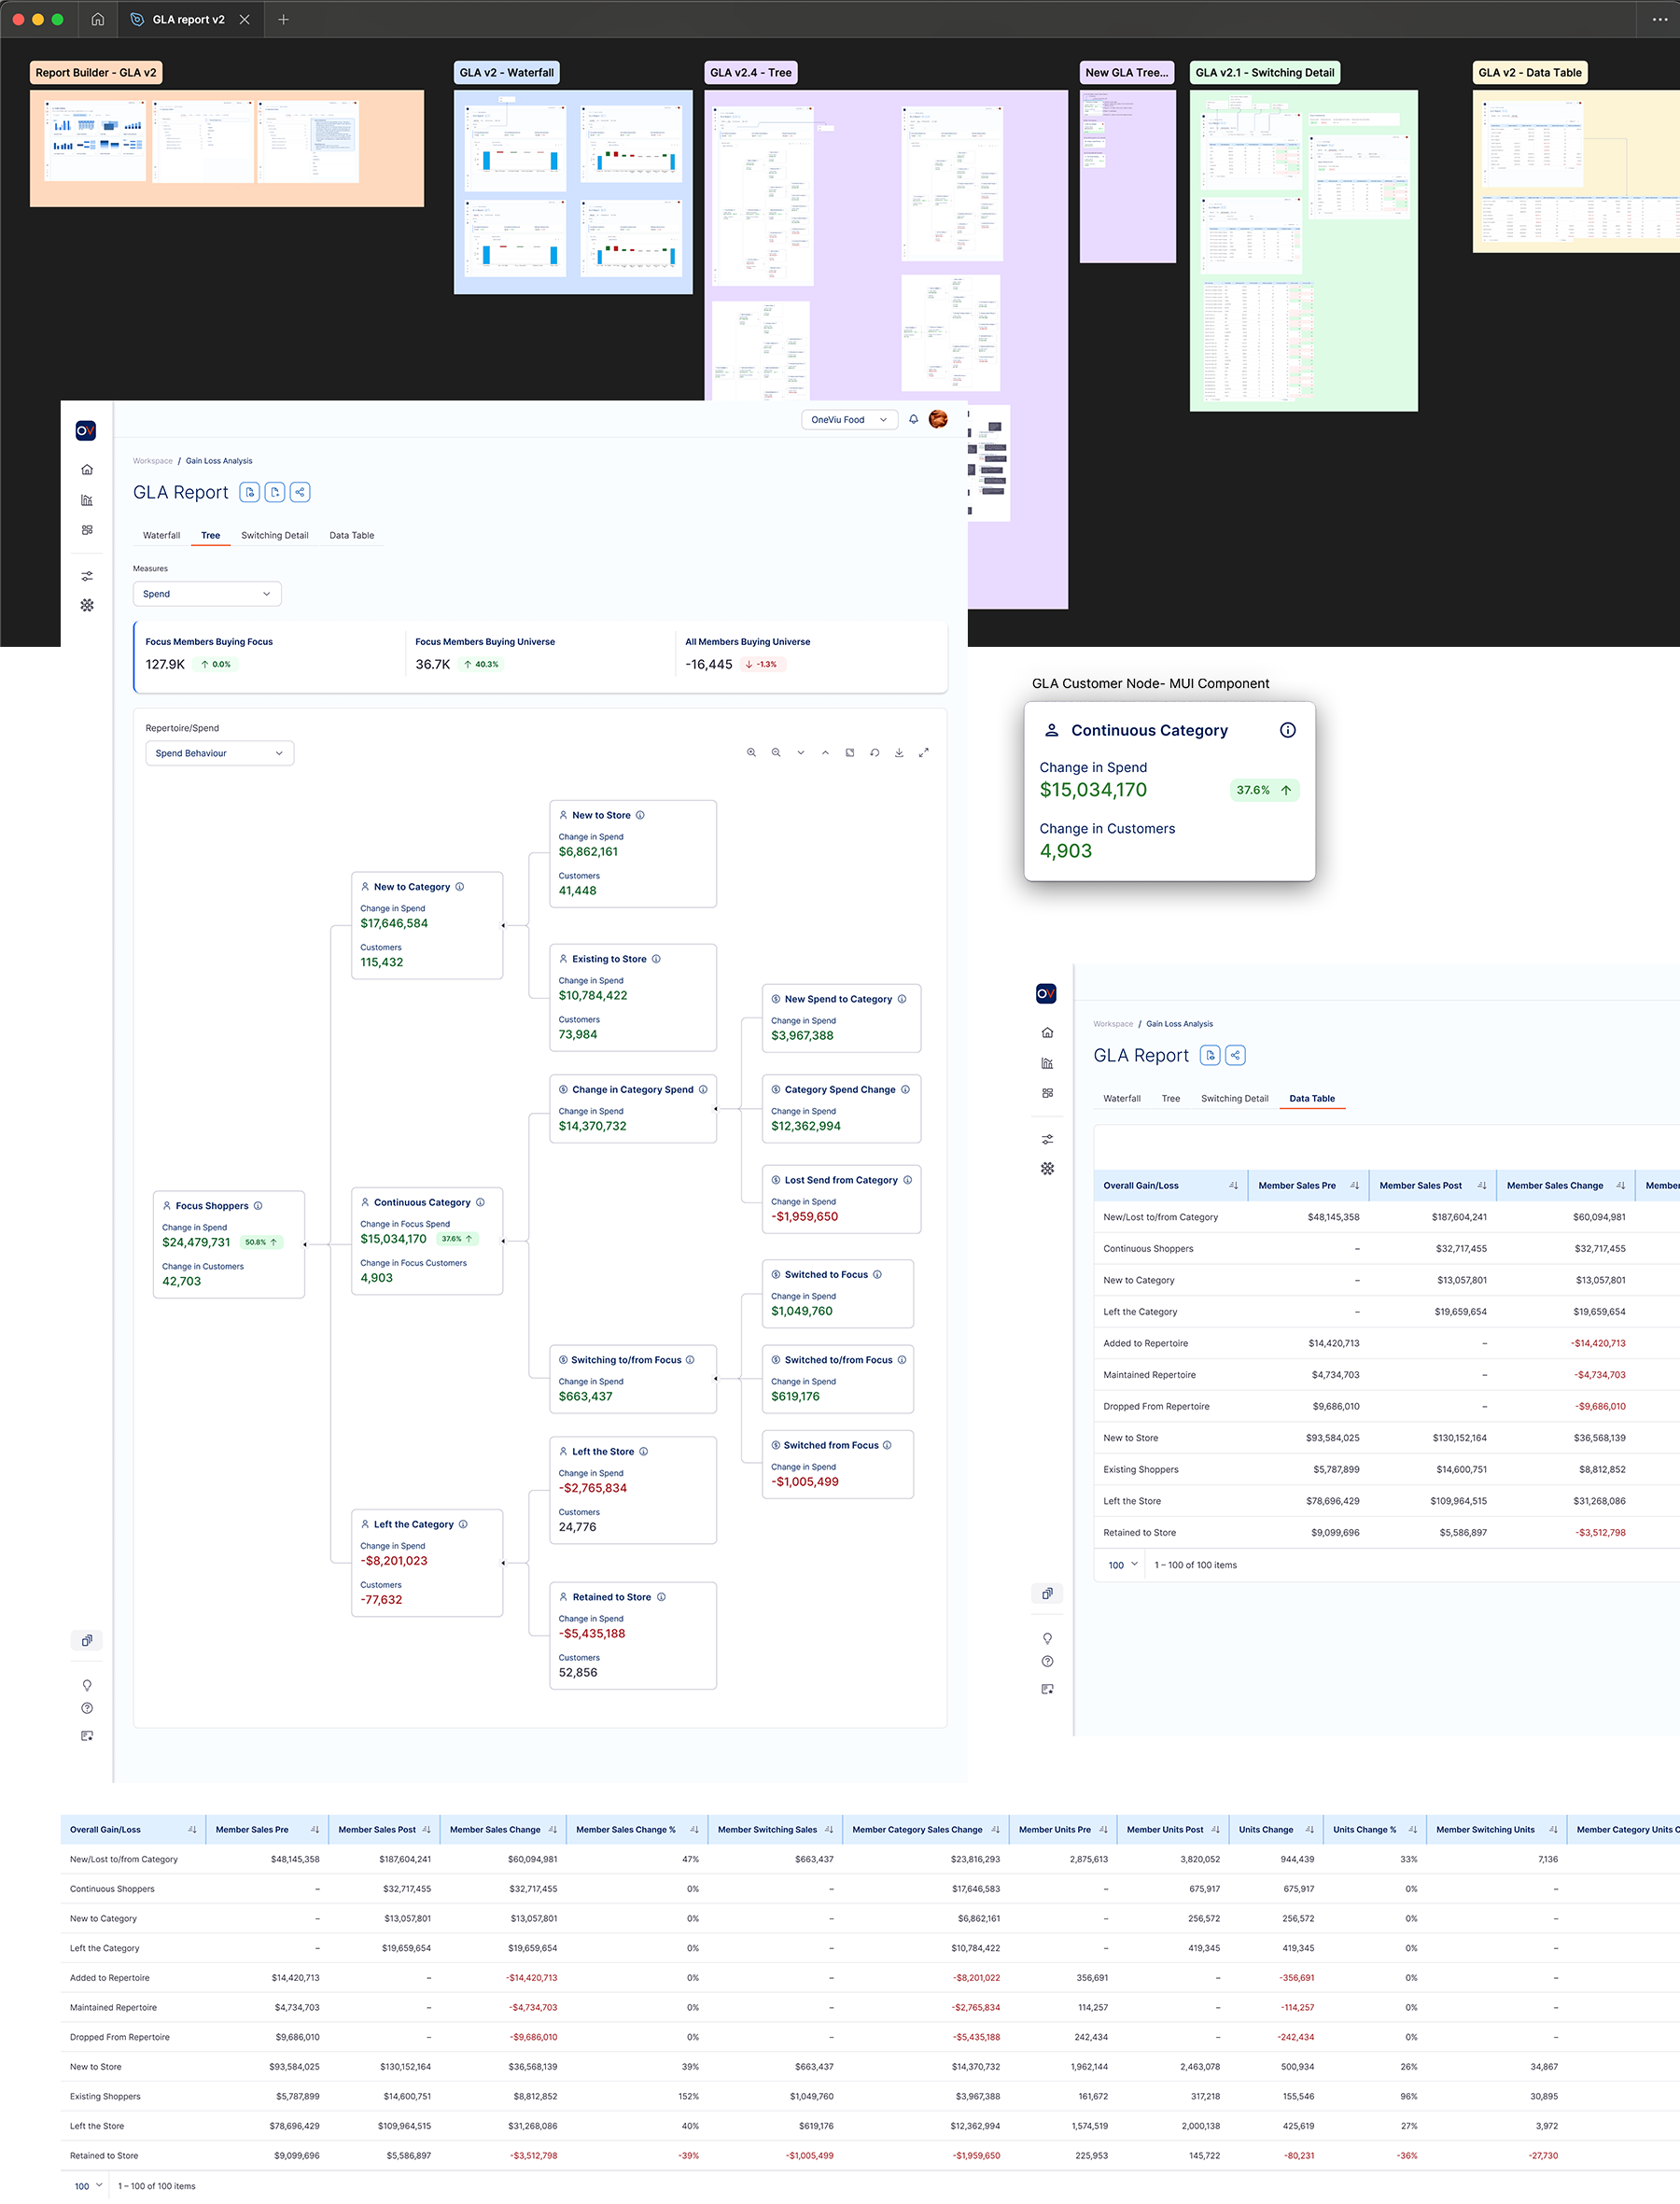
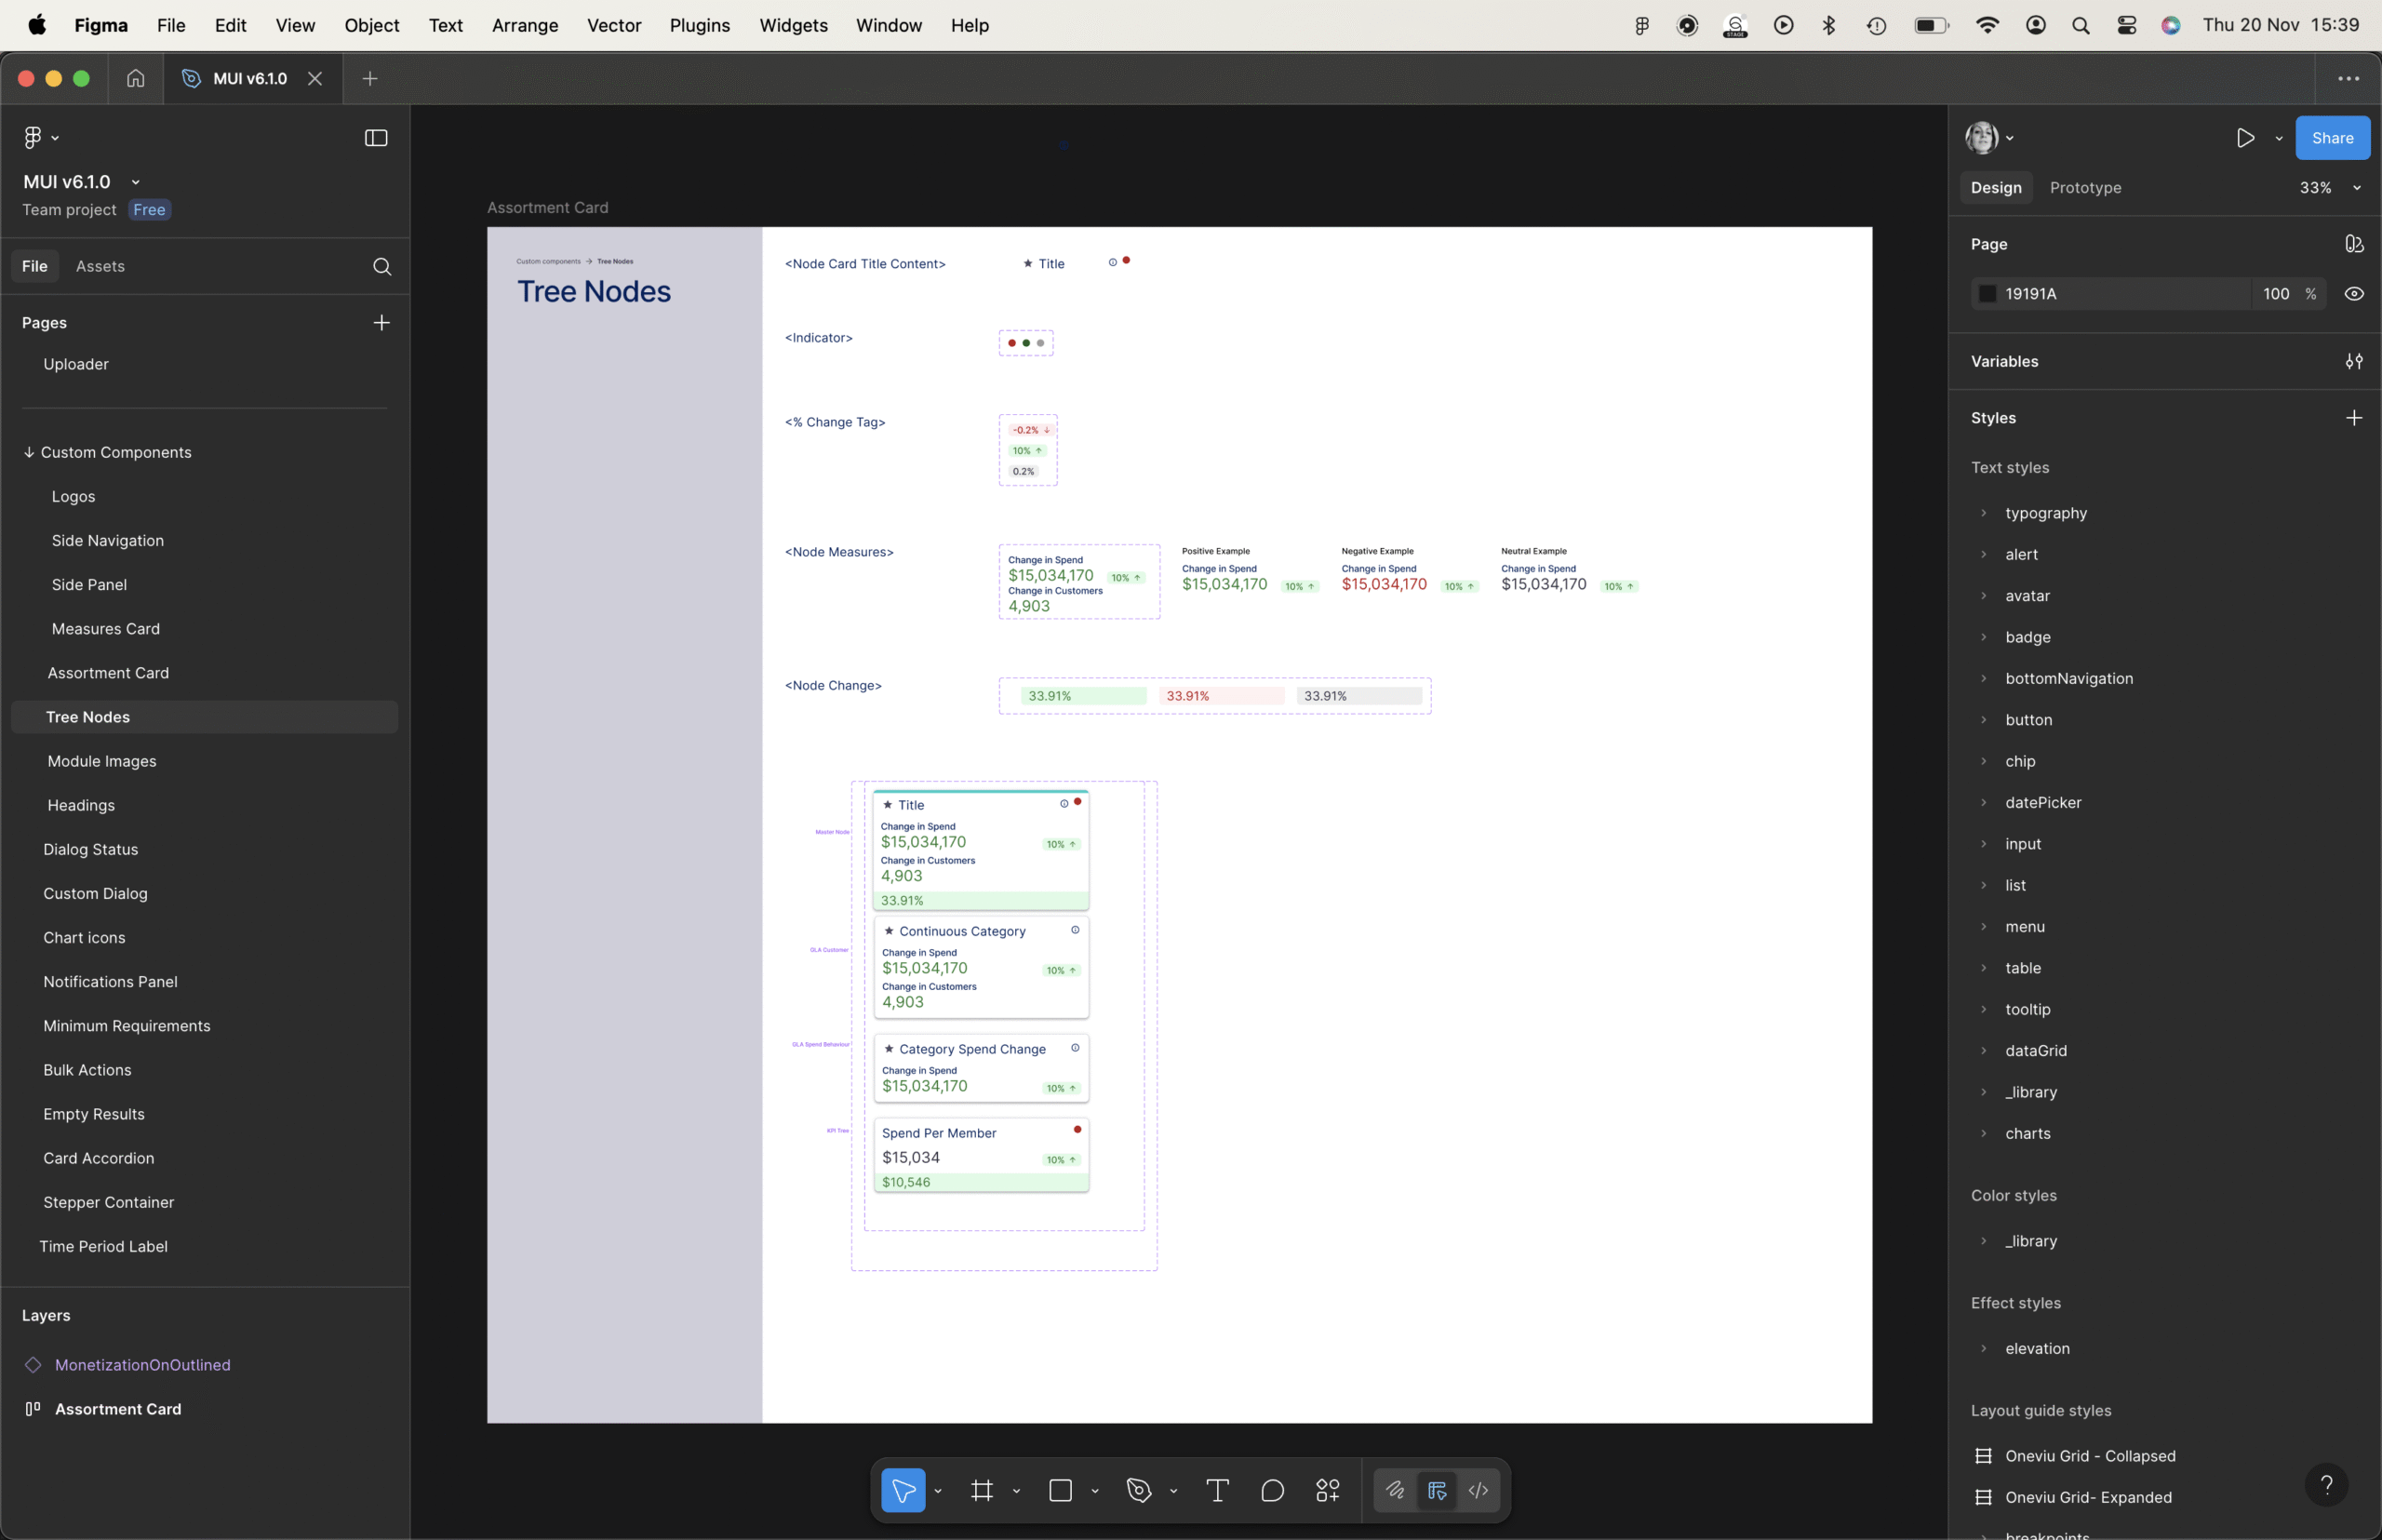
- GLA Report: Redesigned the Gain Loss Analysis (GLA) report to make brand- and SKU-level switching insights clear and actionable. Structured complex data into interactive tree views, waterfall visualisations, and detailed tables. Streamlined multi-focus group and universe selection, enabling analysts to explore switching behaviour efficiently. Designed visual cues and interactions to make insights transparent and easy to interpret for enterprise users.
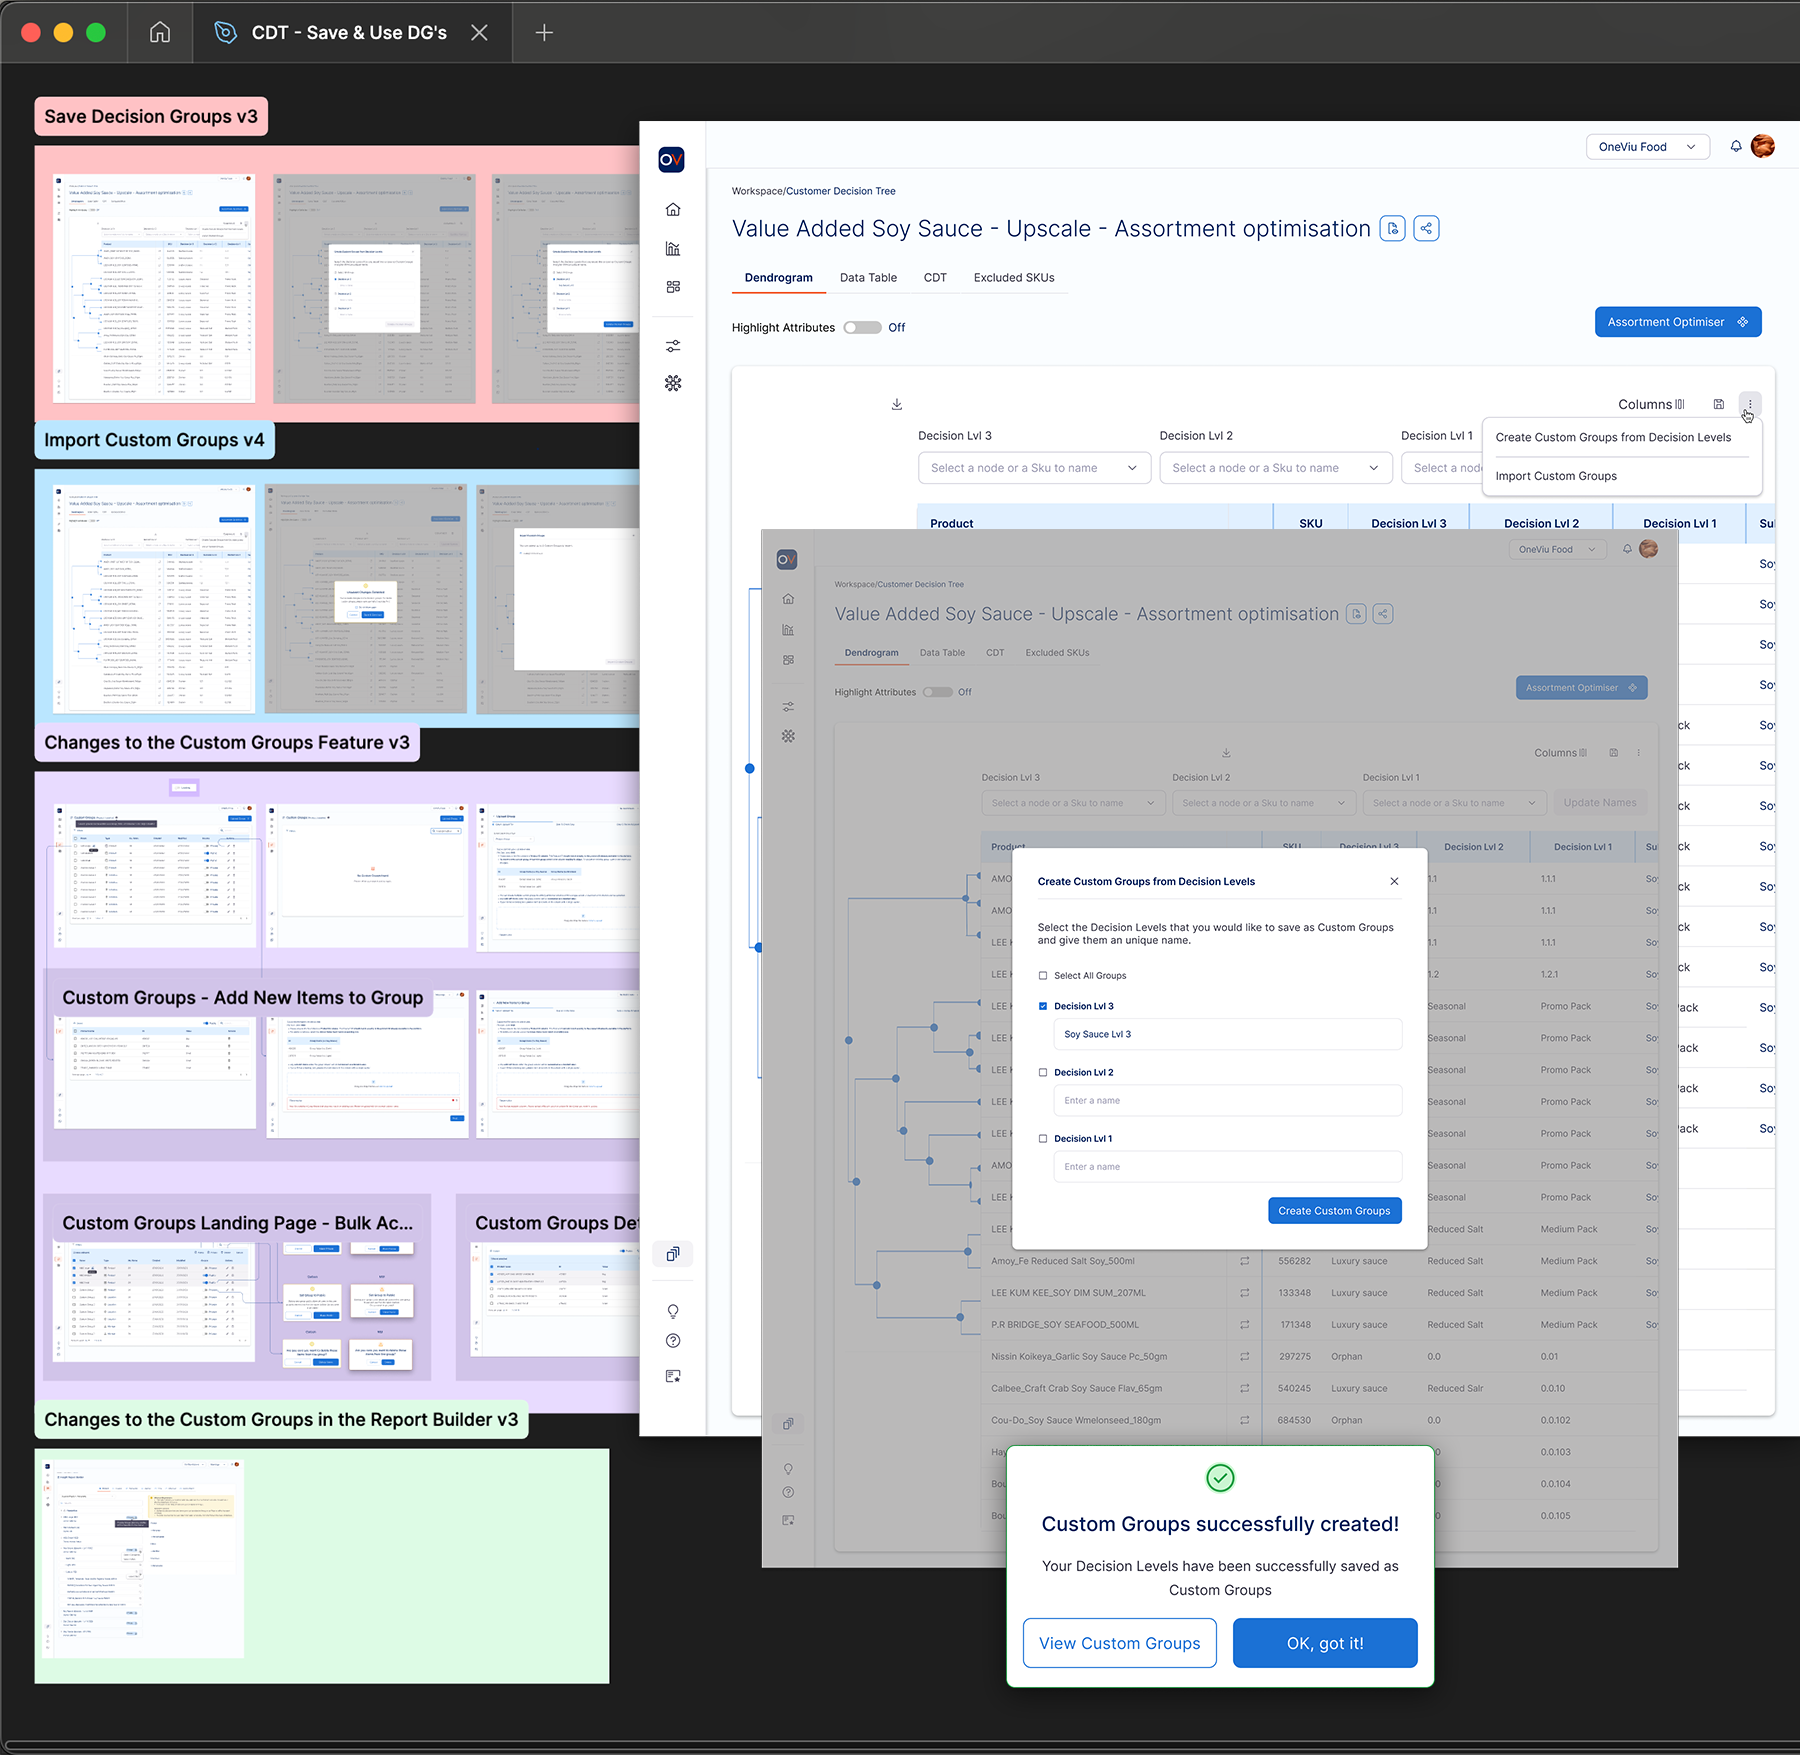
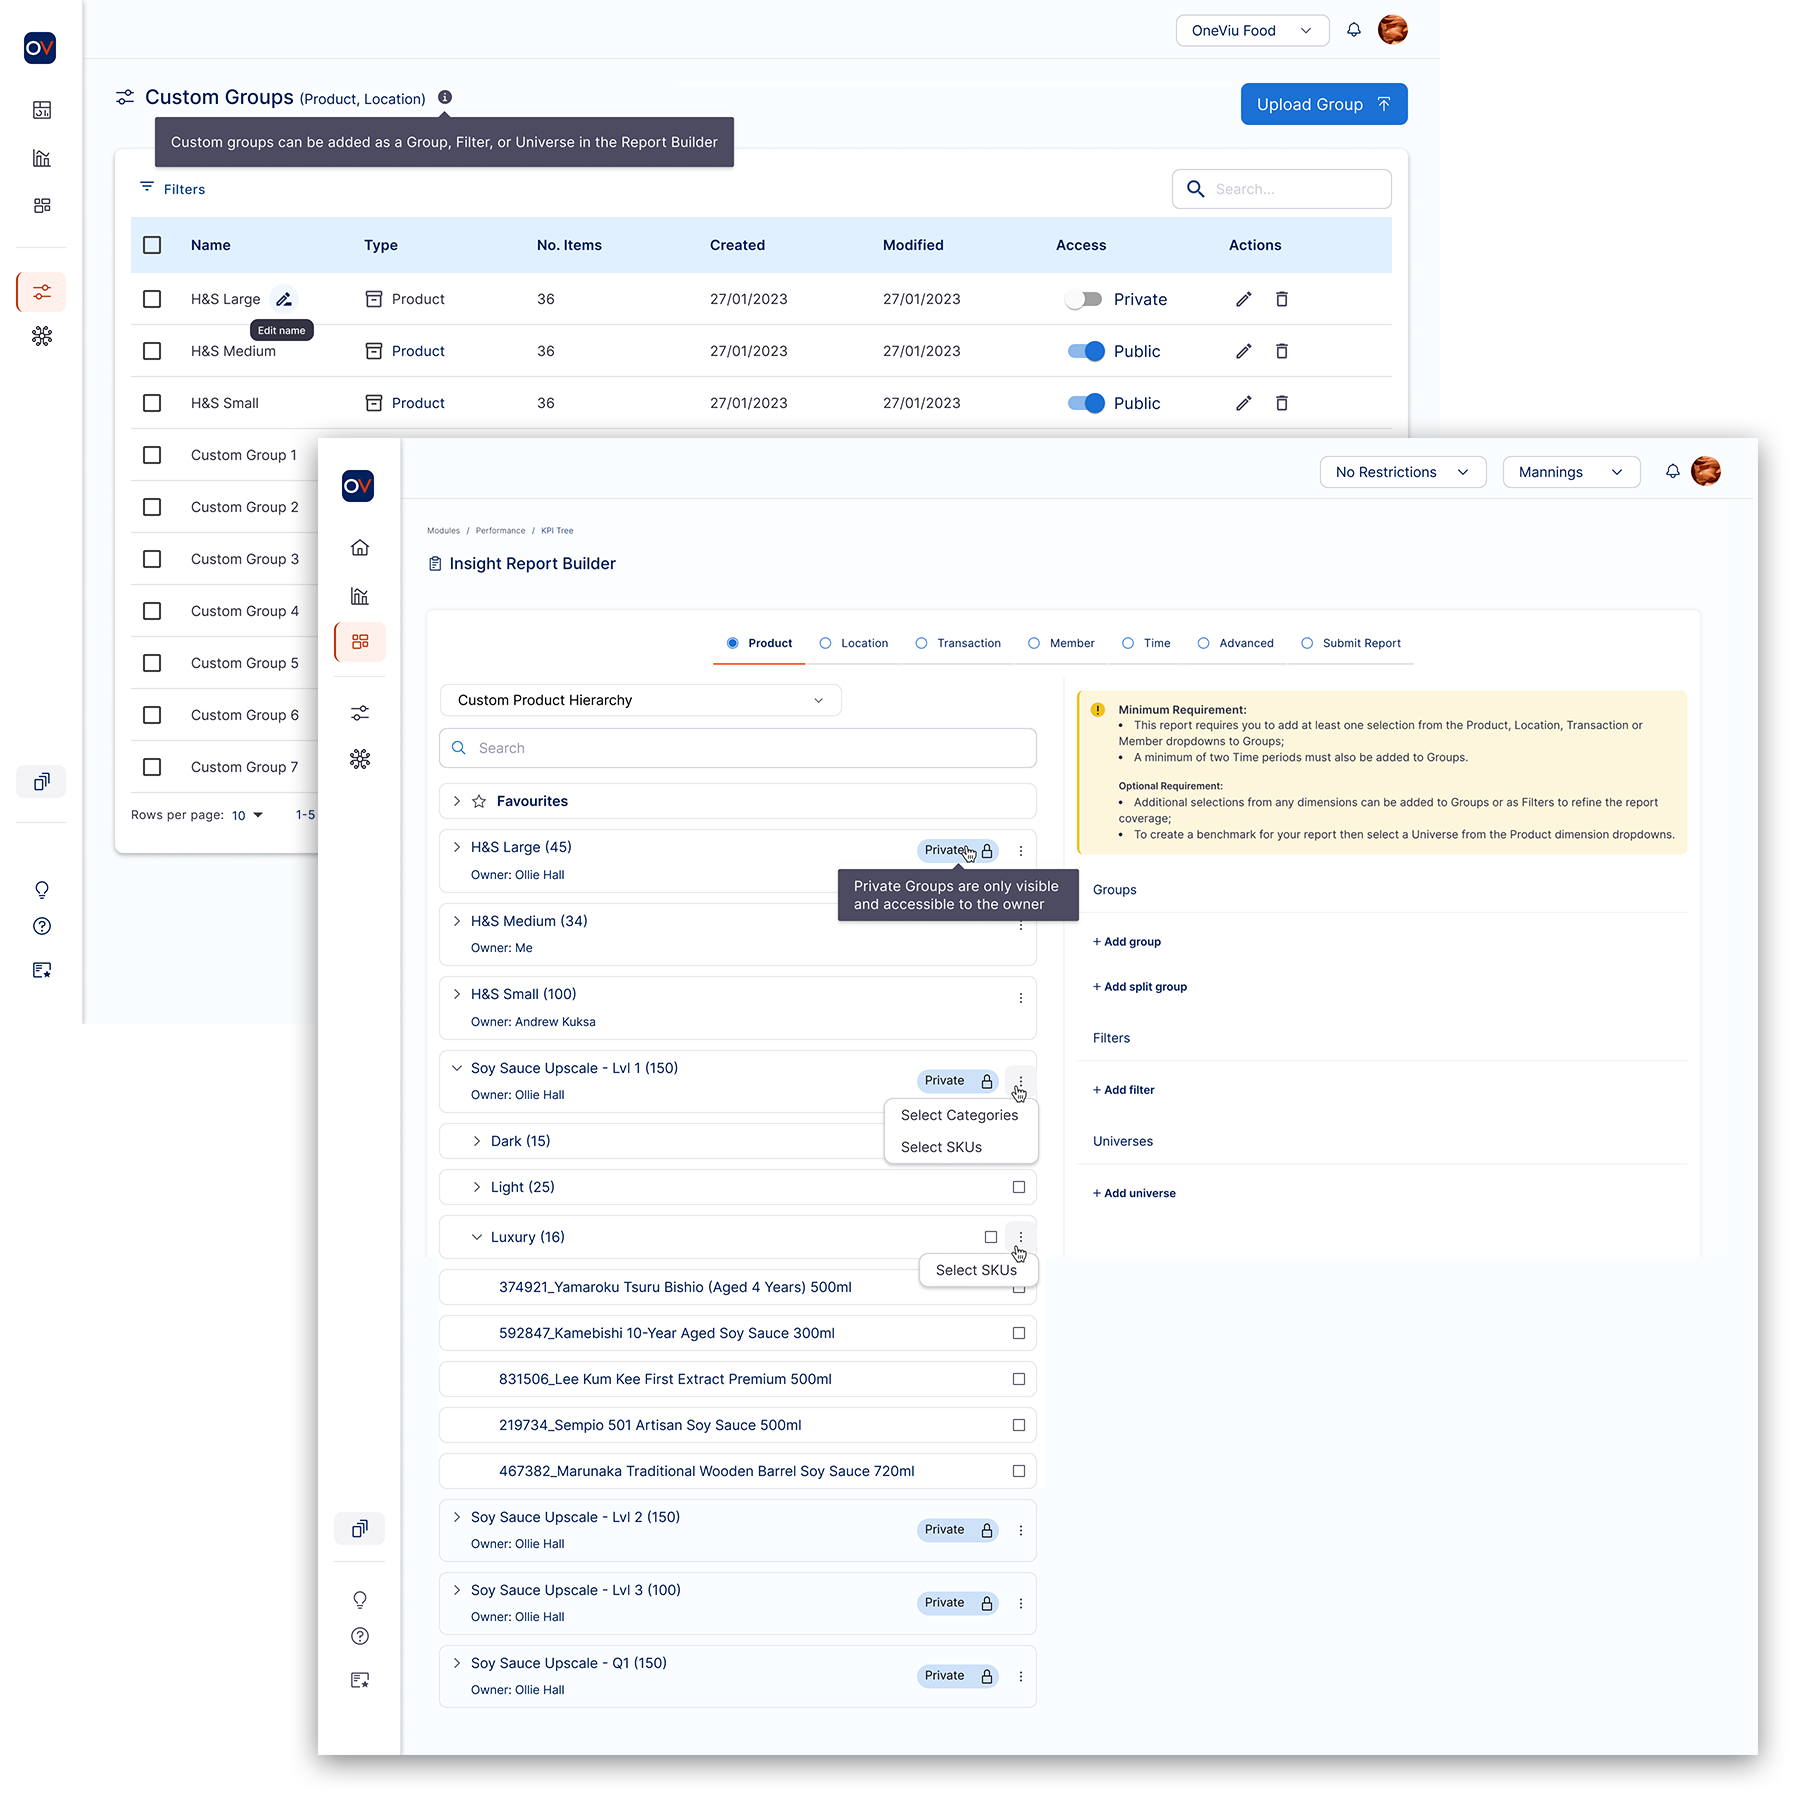
- Save & Use Decision Groups – Customer Decision Tree (CDT) Report: Redesigned the CDT workflow to let users save and reuse custom Decision Groups across reports, reducing manual work and preserving insights. Added parent-child hierarchies, a GUI for saving Need States as custom groups and importing them into the CDT, and integrated the feature into the Report Builder, streamlining workflows and supporting scalable enterprise decision-making.
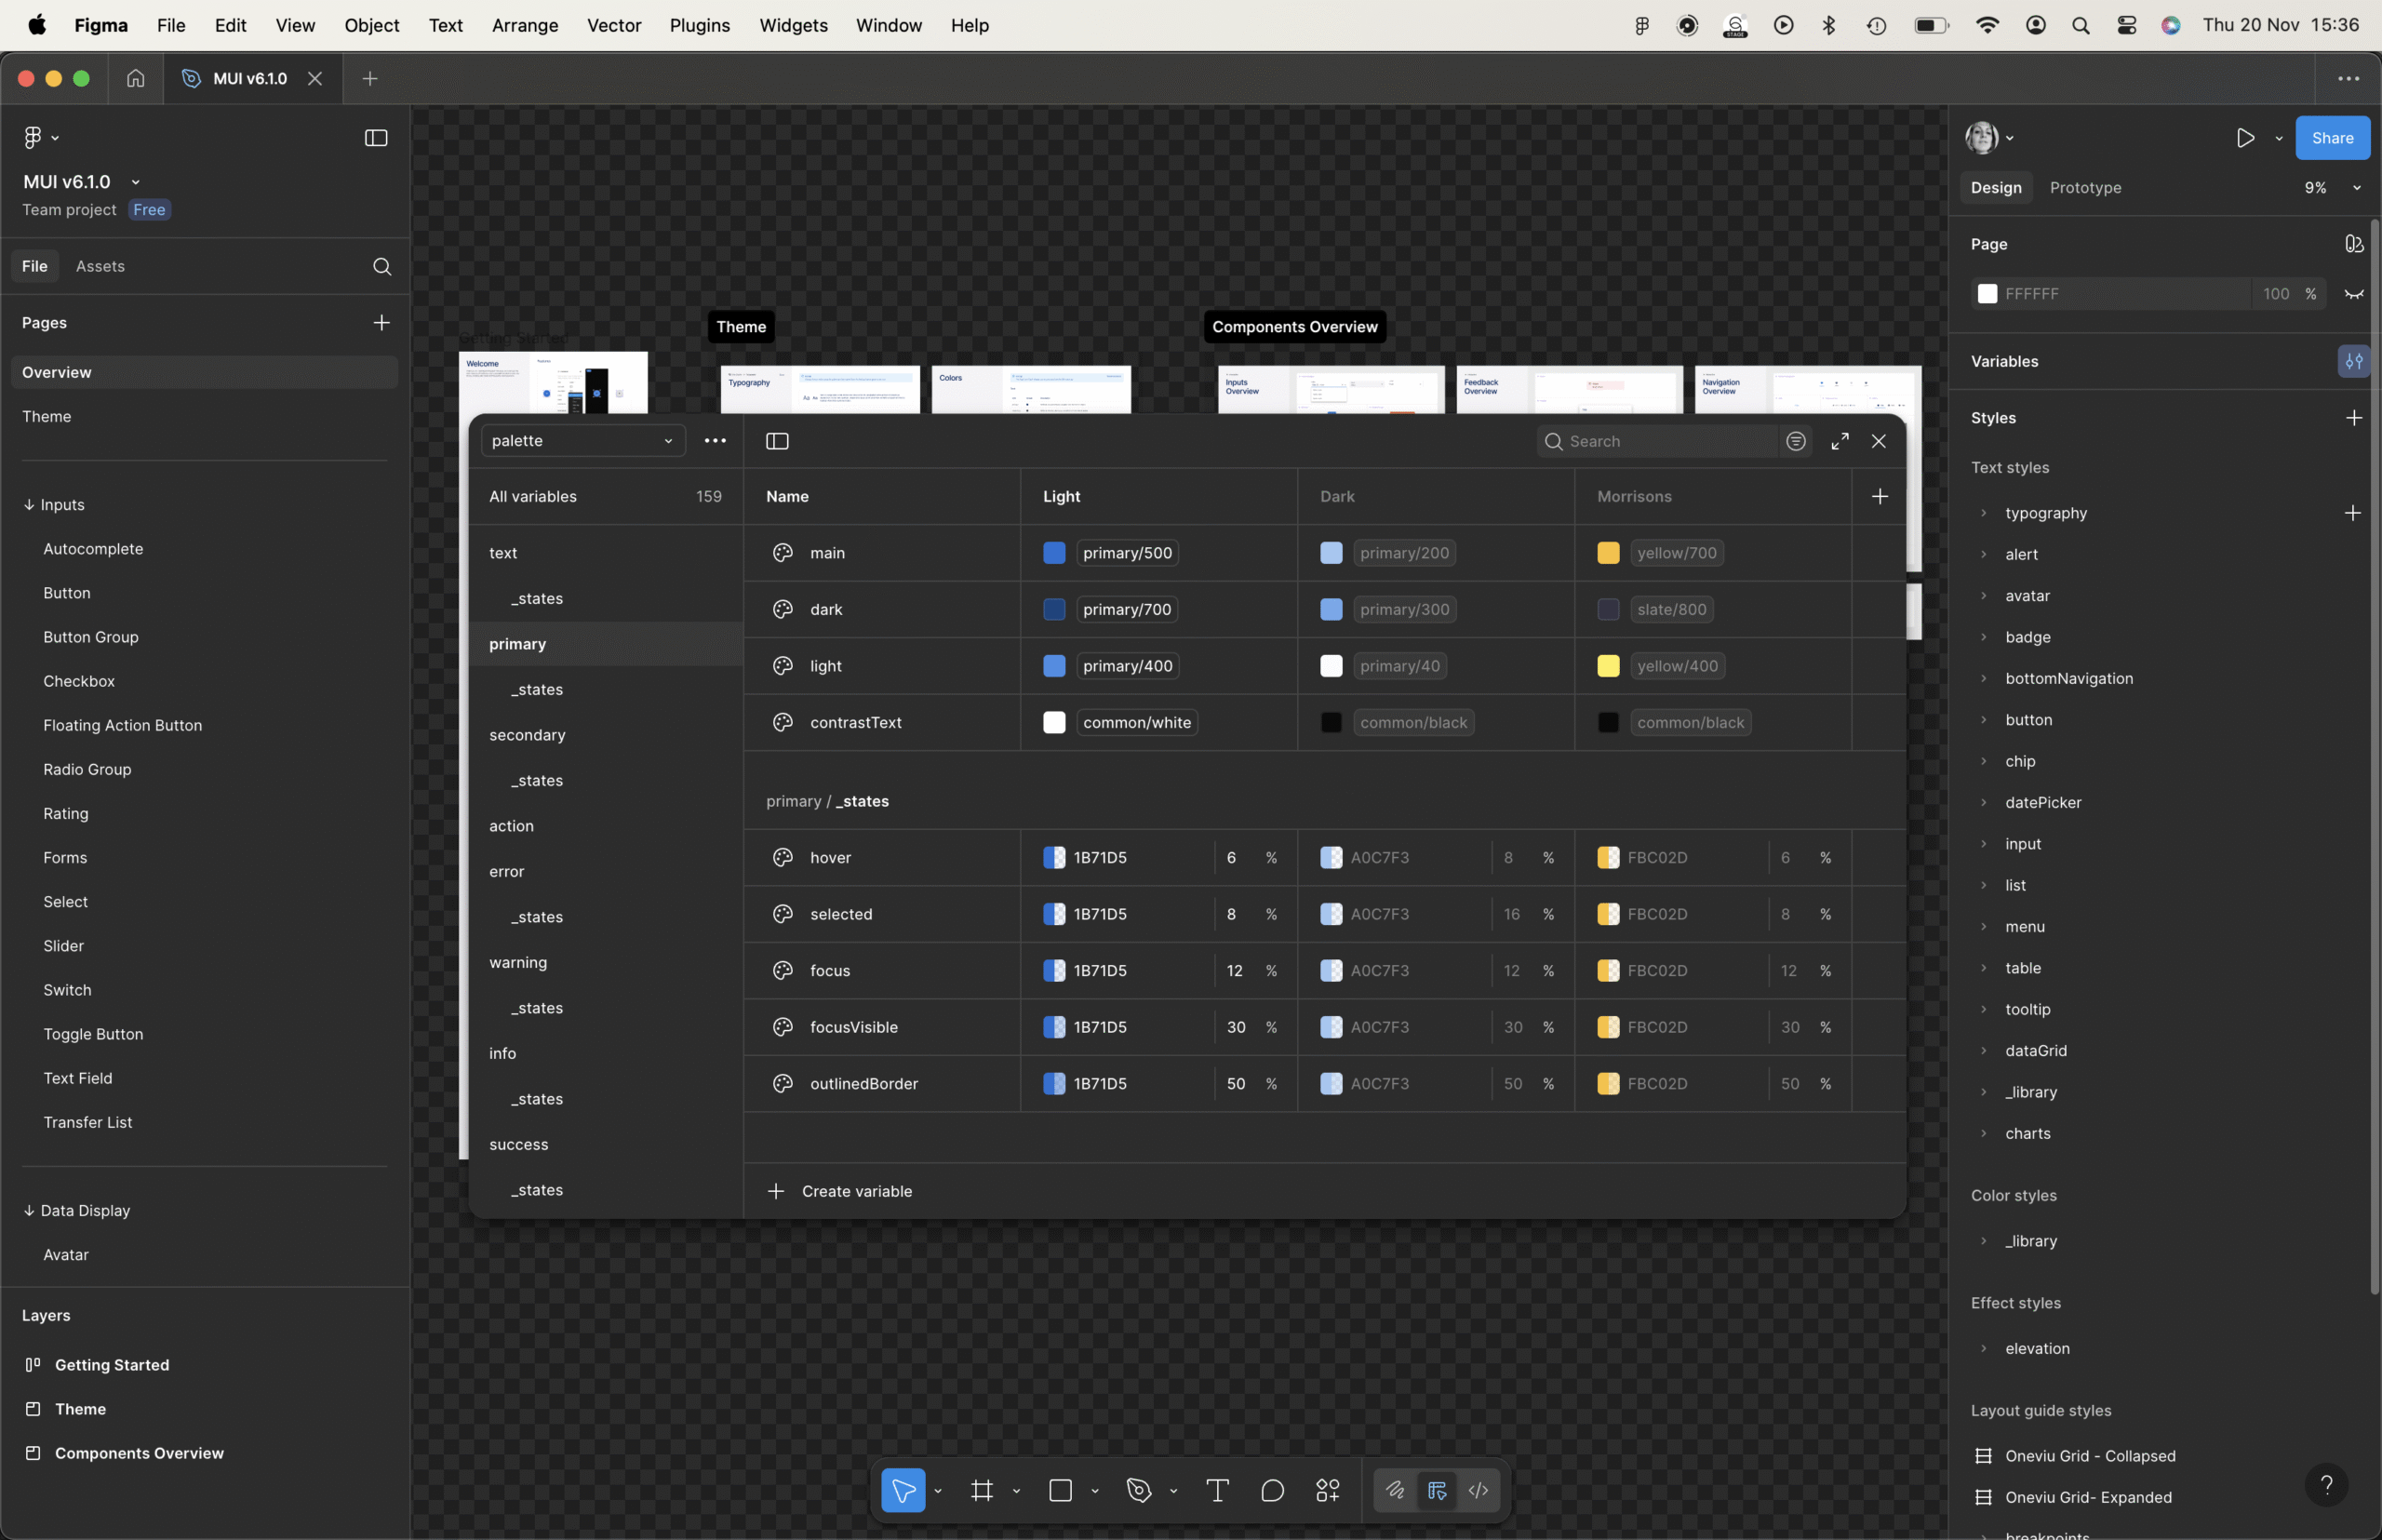
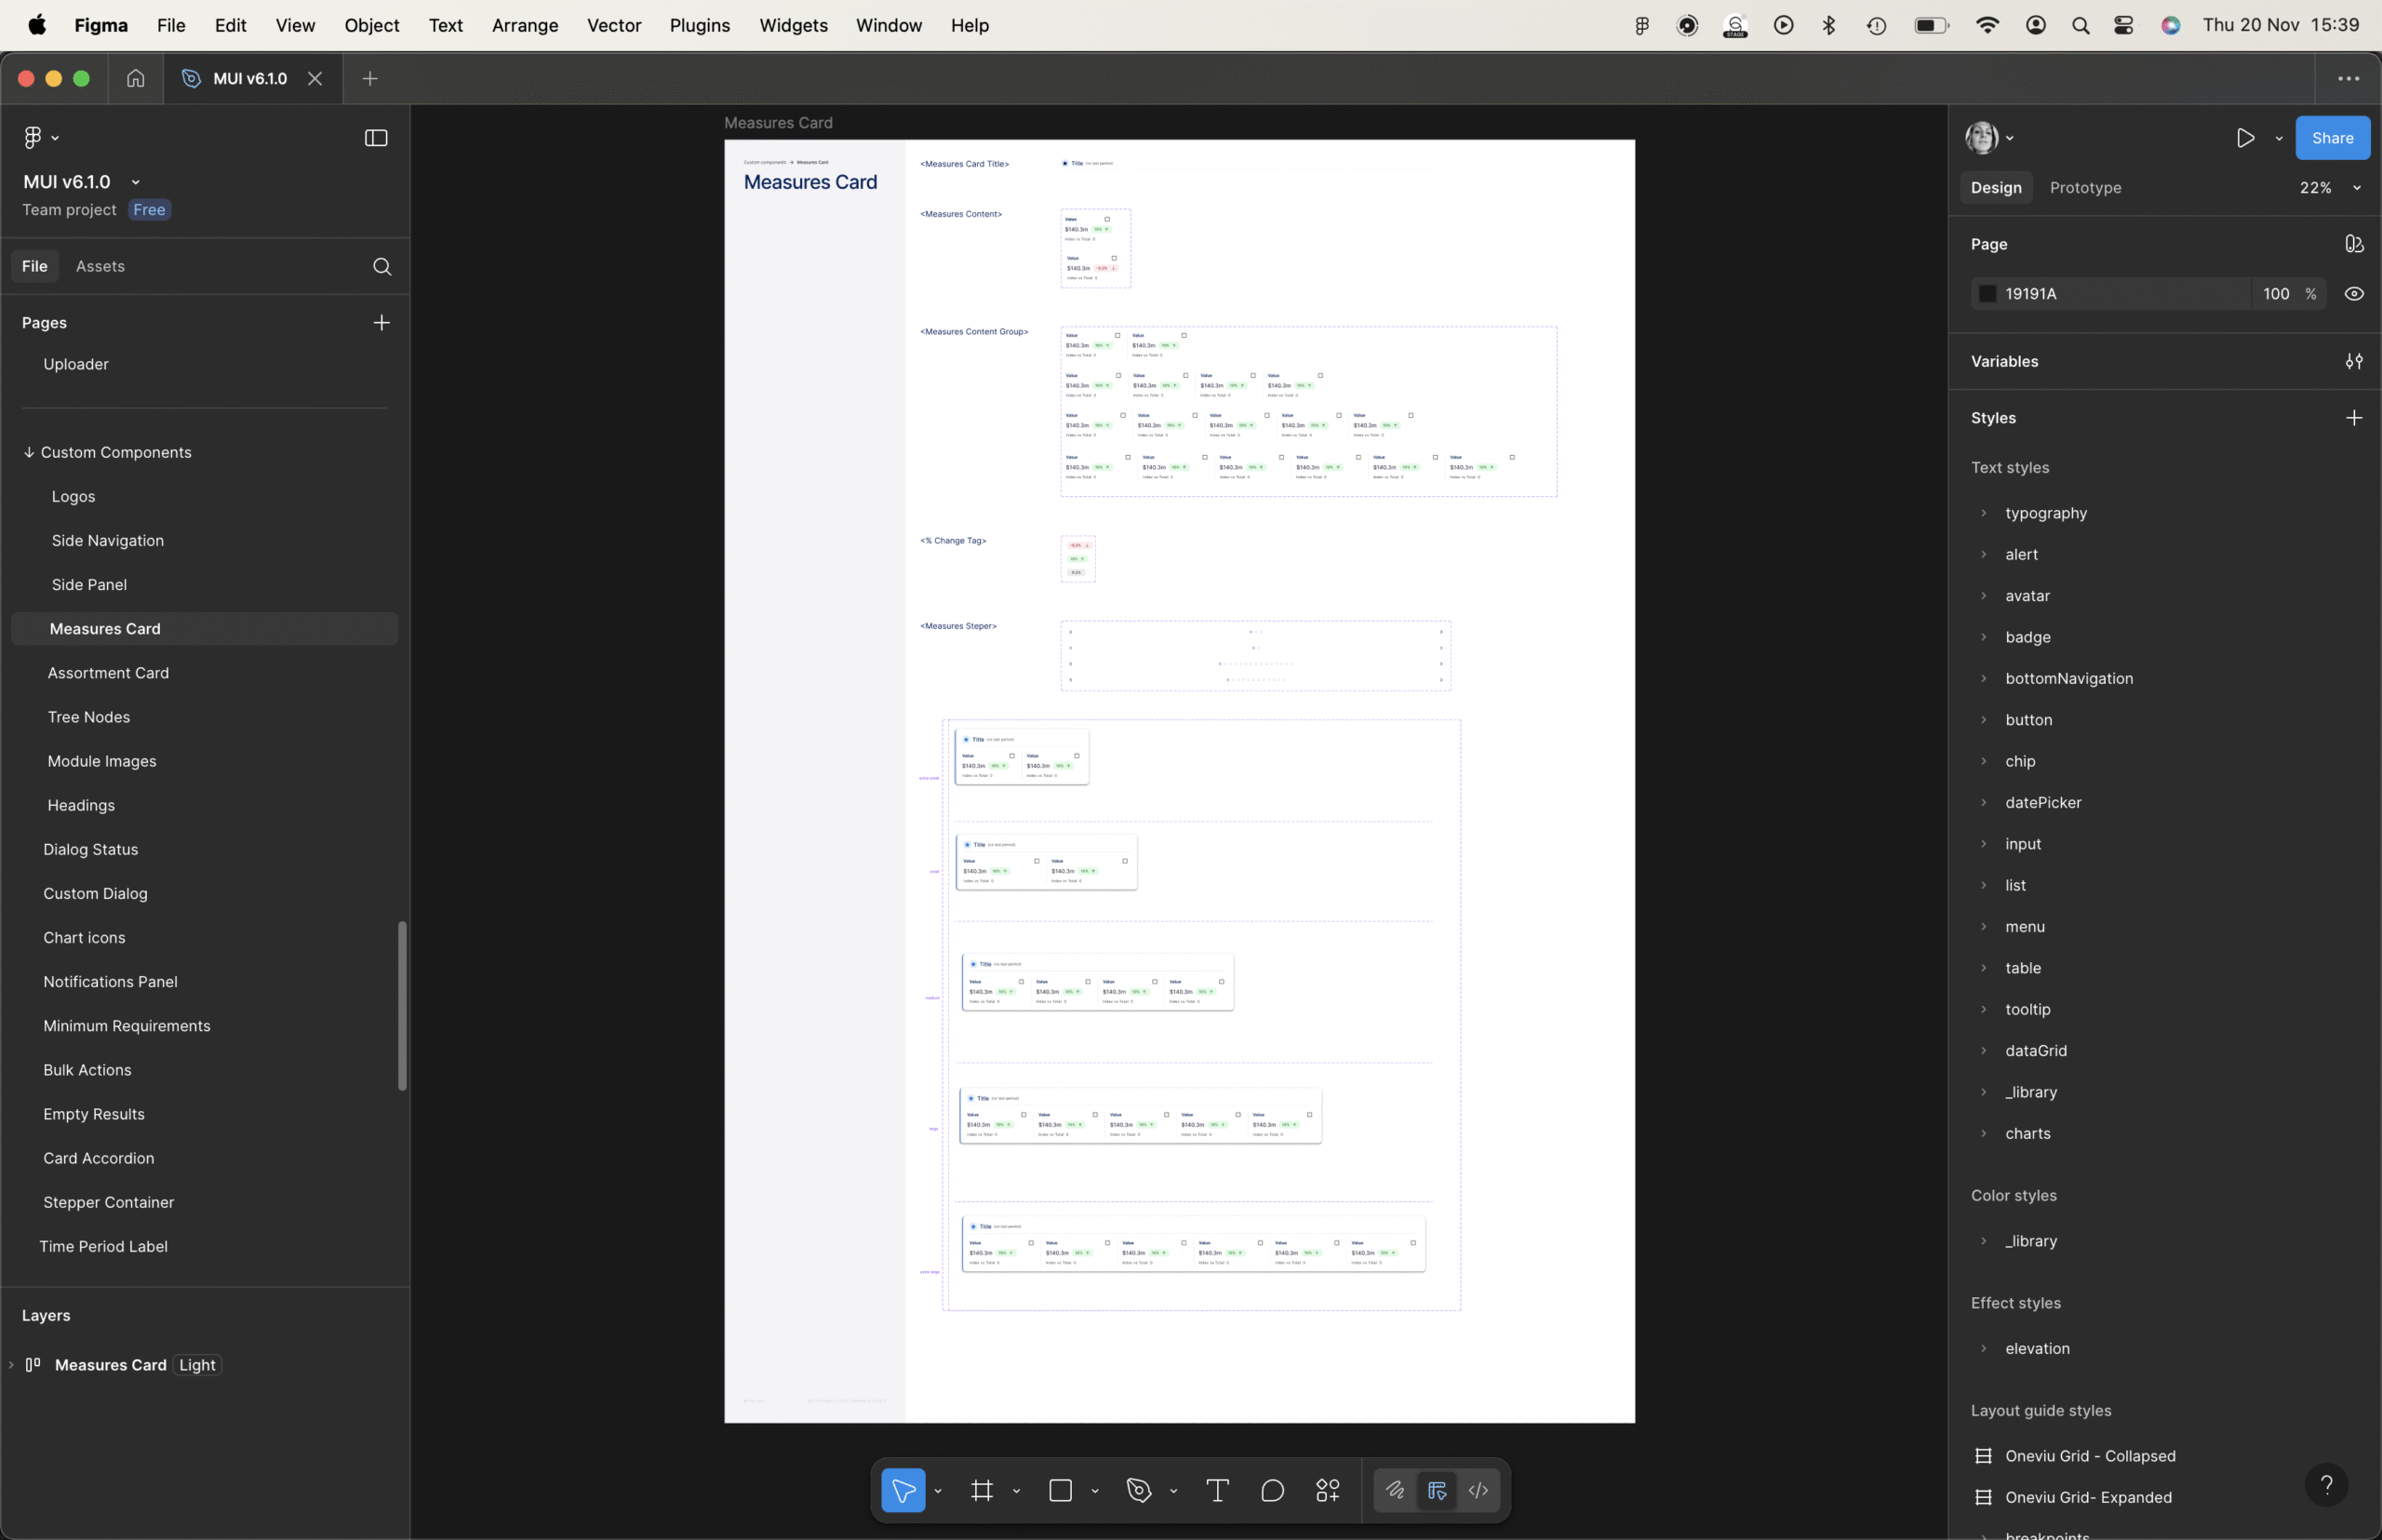
- MUI Migration: Led the UX/UI design and migration from Carbon Components to Material UI (MUI) across the entire platform, modernising navigation, workspace tables, upload flows, dashboards, and Insights modules. Co-led migration strategy, defined UX improvements, validated components with engineering, and maintained a central Figma workspace documenting all components, states, and behaviours.
Collaboration
Across these projects, I worked closely with:
- Product Managers & Stakeholders: Defined features, requirements, and success metrics for enterprise clients including CP Group and DFI.
- Developers & Data Scientists: Translated complex analytics and AI requirements into interactive prototypes, secure implementations, and enterprise-ready features.
- Clients & Users: Conducted discovery, testing, and feedback sessions to ensure solutions addressed real-world business needs.
Role
As lead designer, my responsibilities included:
- Conducting user research and internal validation to inform design decisions.
- Creating wireframes, interactive prototypes, and high-fidelity UI designs.
- Iteratively refining designs based on testing and stakeholder feedback.
- Defining interaction patterns for complex dashboards, charts, and data tables.
- Ensuring enterprise-scale usability while balancing technical constraints.
Success Metrics
We measured success through:
- Adoption: High usage rates among Super Users and analysts across CP Group and DFI.
- Efficiency Gains: Reduced time to create reports, analyse data, and generate actionable insights.
- Accuracy: Improved ability to validate Decision Groups, select attributes, and manage time periods consistently.
- Client Impact: Directly supported CP Group POC and contract acquisition, improving satisfaction and decision-making speed.
Outcome
The portfolio of projects strengthened Tecsa’s position as a leading retail analytics platform by delivering:
- Innovative AI Capabilities: Gen AI feature enabling faster, actionable insights from complex data.
- Enterprise-Ready Reports: Store Performance, Shopping Paths, and GLA reports improved clarity, usability, and multi-metric analysis.
- Optimised Workflows: Time Dimension enhancements, attribute management, and CDT Decision Groups reduced manual effort and cognitive load.
- Scalable, Flexible Platform Design: Nested labels, selective sharing, and centralised structures ensured long-term usability and client satisfaction.
Conclusion
Leading these projects at Tecsa allowed me to apply enterprise UX/UI design, product design, and design thinking to complex, data-driven environments. The work demonstrates the power of aligning user-centred design with business goals, delivering actionable insights, and driving client success in large-scale analytics platforms.
Gen AI
Store Performance Report
Shopping Paths Report
Organising and Finding Attributes
GLA Report
Save & Use Decision Groups – Customer Decision Tree (CDT) Report
MUI Migration
Get in touch
I'm excited about the prospect of discussing your upcoming ideas or projects.
I'm here to engage in the creative process and help bring your vision to life.